
I have written about Data Analytics on freeCodeCamp before.
In my previous posts I have provided examples and concepts tied to the foundations of data analytics. And I discussed how you can use the frameworks of this discipline to work across problem sets in multiple academic and professional domains.
Given that the freeCodeCamp community is filled with people who love technology and want to harness software and hardware to make useful and interesting products, I wanted to do a deep dive into applied data analytics and how it can help you professionally.
Specifically, I want to discuss how to think about – and then apply – data analytics to business problems when building companies or products.
For this article I focus on just three core concepts:
- Bayes’ Theorem
- Regression to the Mean
- Risk-Return-Ratio
How to Apply Bayes’ Theorem to the World Wide Web
Let’s take a look at website building and see what that teaches us about Bayes’ Theorem.
First, some context.
For many internet entrepreneurs, building a website or engaging in email automation are the first steps to testing an idea, gathering feedback from users, and monetizing products.
But how do you know what type of website to build? And how to know if your website or affiliate marketing programs are performing well?
Data analytics provides important directional answers.
When building a website or software product it helps to be passionate about it. But passion alone is not sufficient for driving successful outcomes. Passion, partnered with data, can unlock new insights and value.
Take a look at this Behavioral Flow chart from Google Analytics for a Wordpress chatbot. What do you see?
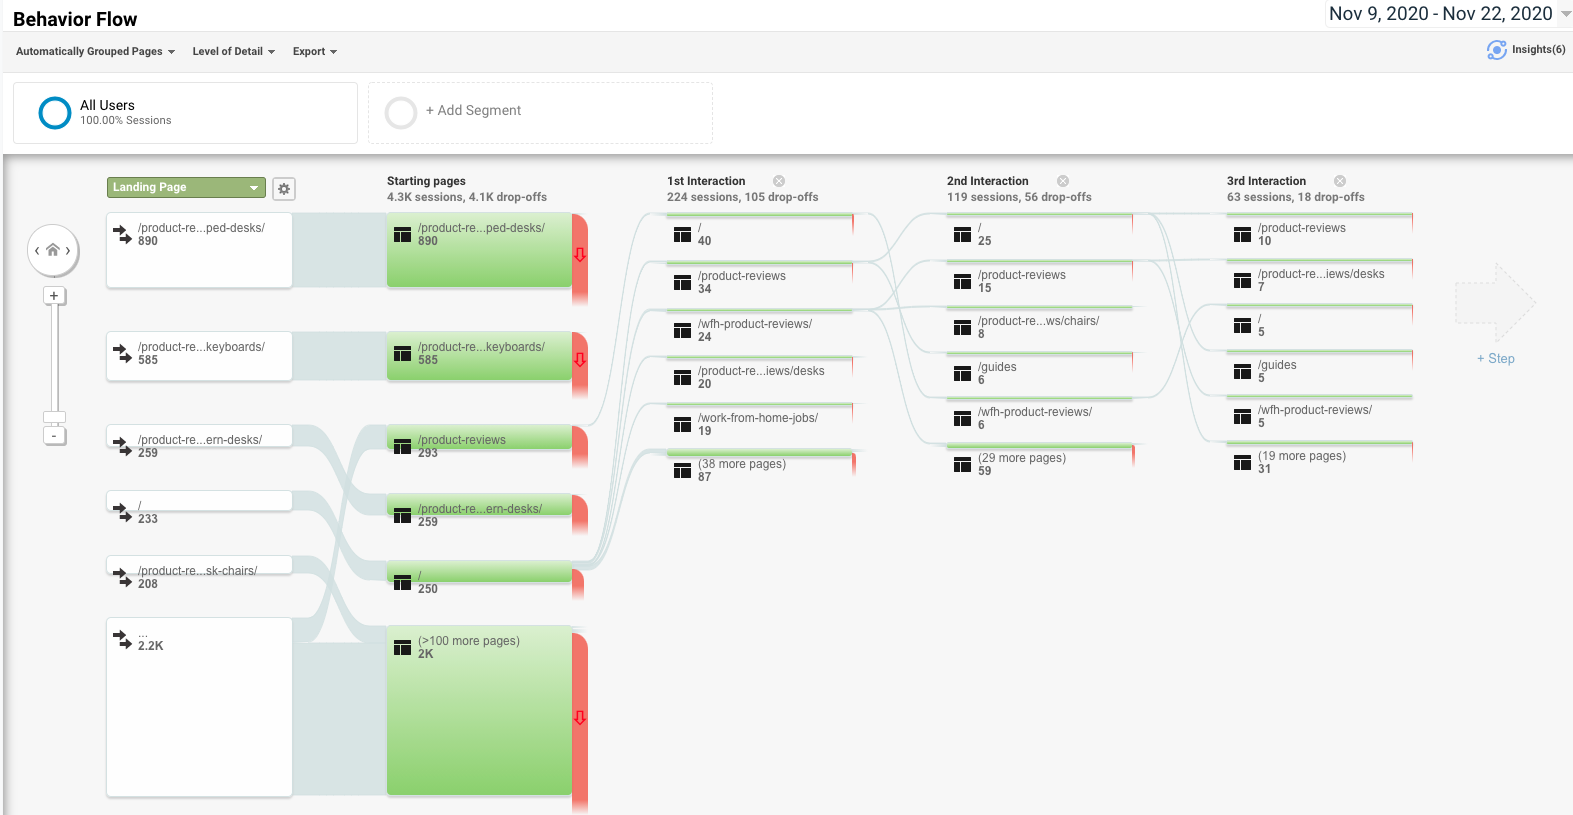
A critical concept in Data Analytics is Bayes’ Theorem. It describes the probability of an event, based on prior knowledge of conditions that might be related to the event.
For example, let's say the risk of a user leaving my website is known to increase as the user spends less time on the homepage. Bayes' Theorem allows the risk of an individual leaving to be assessed more accurately (by conditioning it on time spent on the home page) than simply assuming that the individual is typical of the population as a whole.
Think about that for a moment. The implications for how you design and build products is profound.
By leveraging Bayes’ theorem I can better understand how users spend time on my site and where and why they are likely to leave.
Without the application of this theorem, I might erroneously examine all users as if they had the same attributes – when in reality they do not.
A user who spends more time on the homepage is more likely to spend more time on the branch pages and therefore be a better customer (in the case of a website I built).
Challenge yourself to apply Bayes’ Theorem to your current learning and work. By calculating conditional probabilities – and using the past to help guide the future – what can you do differently? Or better?
Regression to the Mean
The second core data analytics topic I find of particular relevance to technology and learning about software is regression to the mean. This concept exists everywhere – and, as we will discuss, that is both good and bad news.
Regression to the mean explains the phenomenon that arises if a sample point of a random variable is extreme (nearly an outlier).
Future points will be closer to the mean, or average, on further measurements.
This concept is very important when looking at website traffic, e-commerce sales, or while conducting product quality tests.
Let’s say your average website is made up of X pages. A key ingredient of your success will be how well your user’s interact with the content on your pages. And a key driver of that is how responsive and fast your pages are.
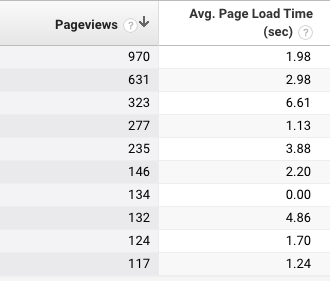
Within Google Analytics (and other customer analytics software to measure website performance) you can easily measure your average page load time.
What would you expect to happen if one of these pages opened slowly – in nine seconds – or very fast – in .04 seconds?
Based on the data, we would not expect these outlier results to happen repeatedly. In fact, we expect future data points to be closer to, or equal to, the mean.
When learning how to code or build your first product, make sure you understand your true averages. If you get data that is widely different, expect future data that reverts to the mean.
This knowledge can help you better understand the future (because you have an idea of what is coming) and, as such, you can set expectations accordingly.
Risk-Return-Ratio
How much should you risk for a certain gain? The risk-return-ratio is a measure of return in terms of risk for a specific time period. You might not be intimately aware of this formula, but I believe you should be.
How can you build a product, make an investment in a business, or solidify the launch timelines of your software without an understanding or risk and return?
Arguably you cannot.
Here is one example. For one website, the majority of traffic comes from organic search, or Search Engine Optimization.
This means that the website doesn’t pay to acquire traffic directly but that it is subject to the whims of search algorithms that control the flow of visitors to the site.
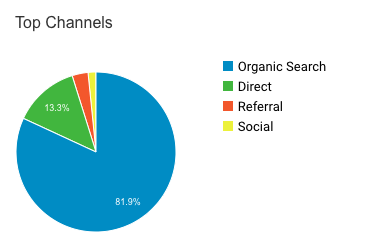
Do you think that this site is over indexed on search? How would you diversify traffic to get similar returns but with less risk? One way is to apply the principles of diversification which is a technique that reduces risk by allocating resources in different categories.
If you maximize returns by investing in different areas that would each react differently to the same event, your website (or product) can reduce risk while still maintaining strong upside.
Bringing It All Together: Applying Data Analytics In the Real World
As I have argued before, data analytics is the process of inspecting, cleansing, transforming, and modeling data with the goal of discovering useful information. There are many concepts that are worthy of a deep dive into this field.
When thinking about applying data analytics to your work – including research, coding challenges, and product building endeavors – the most impactful to understand and apply are Bayes’ Theorem, Regression to the Mean, and the Risk-Return-Ratio.
It doesn’t matter if you are building a landing page, a robust website, a mobile application, or enterprise tools like employee engagement software. Data is your friend.
Data is among the fastest and most cost effective contract engagement processes. It always shows up and is ready to guide you.
If you want to build great products you will need data. You will need time to evaluate and use this data.
And you will need tools – like the ones that Data Analytics provides – to unlock insights and better serve your users.
This is why data analytics is important to study but even more important to apply in practice.