

At some point, a map project needs more than markers and polygons. You want something to happen on the map: water moving up a street, smoke drifting with the wind, or a shockwave spreading out from a point.
The first time I tried this, I did what seemed obvious to me. I put a <canvas> on top of the map and drew my animation on it.
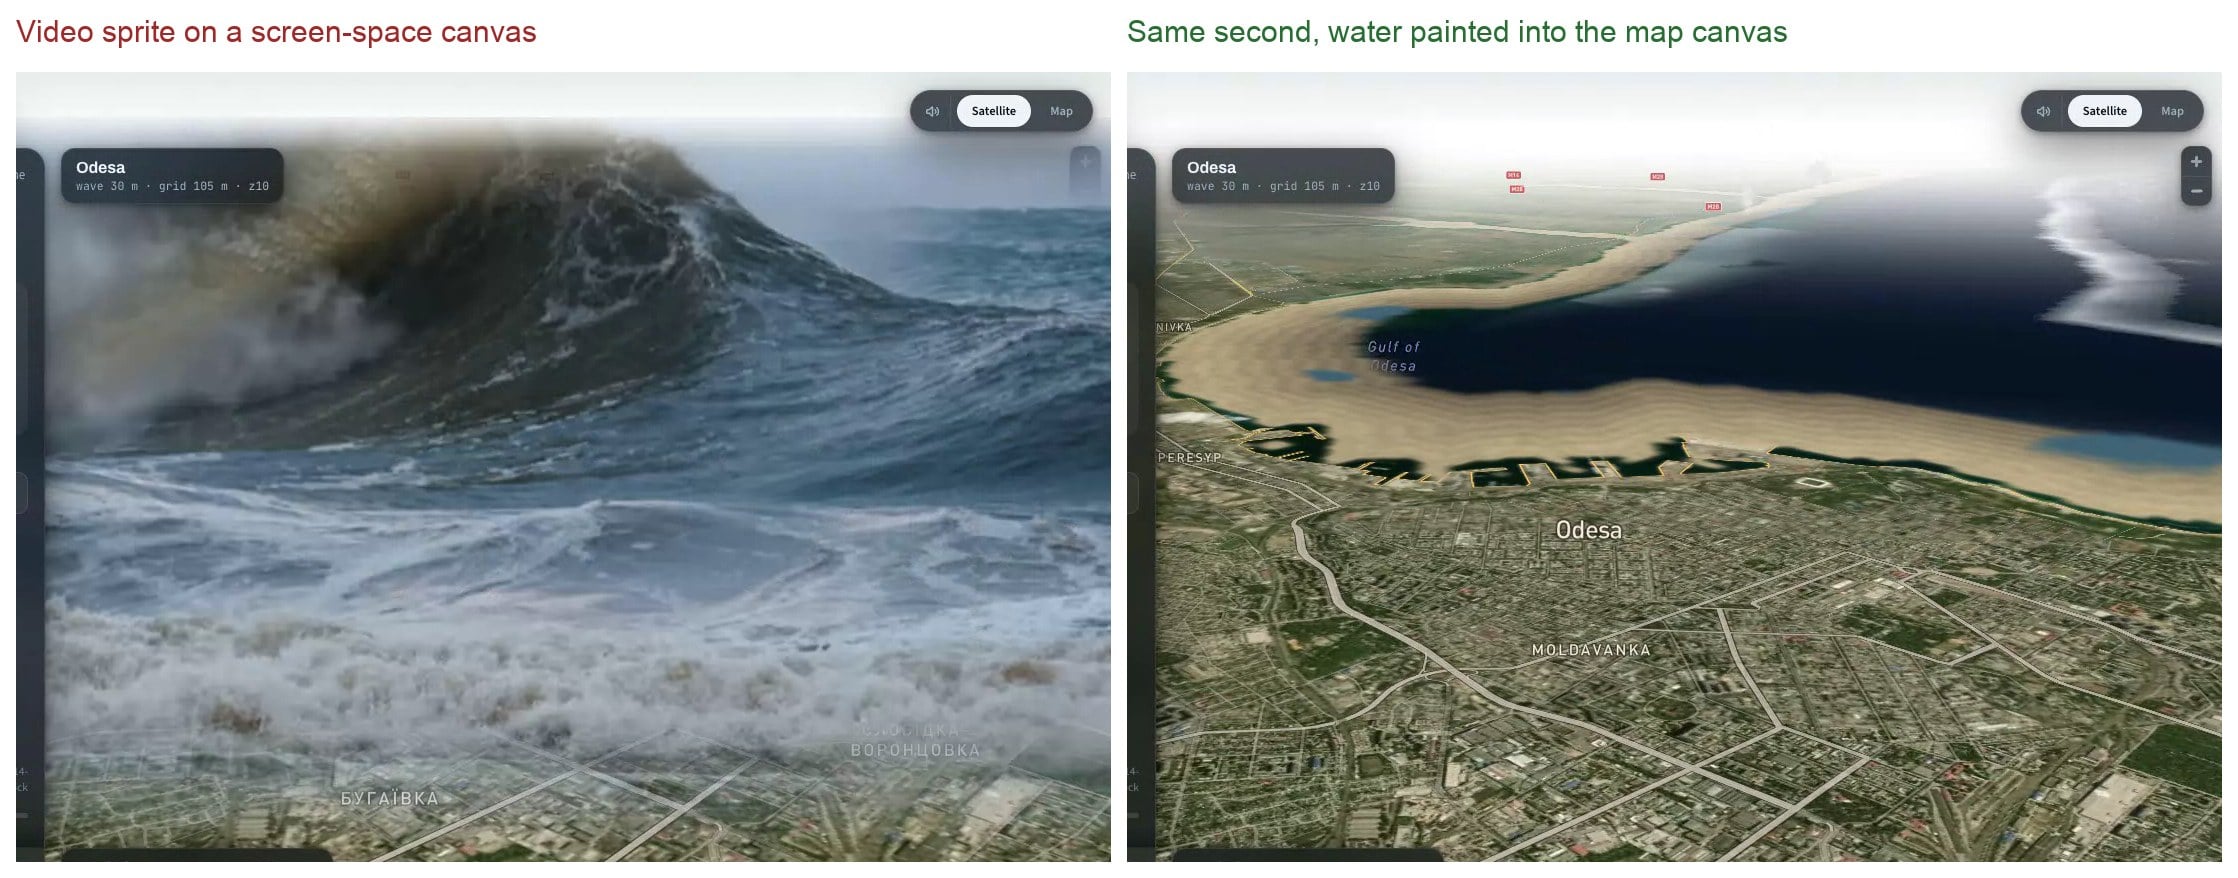
But it looked wrong in a way I couldn't fix with more polish. The effect had edges. It floated above the ground. And as soon as I tilted or rotated the map, it stopped lining up with anything underneath.
I hit this while building HazardSim, a browser simulator that runs natural disasters on a real map. The tsunami scenario went through about a dozen rewrites before it stopped looking like a cut-out pasted over the city.
Much of the testing, and a good share of the bug reports, came from my 12-year-old son Tim, who turned out to be a more patient tester than I am. Most of those rewrites taught me the same thing from a different direction: draw your simulation in map coordinates, not screen coordinates.
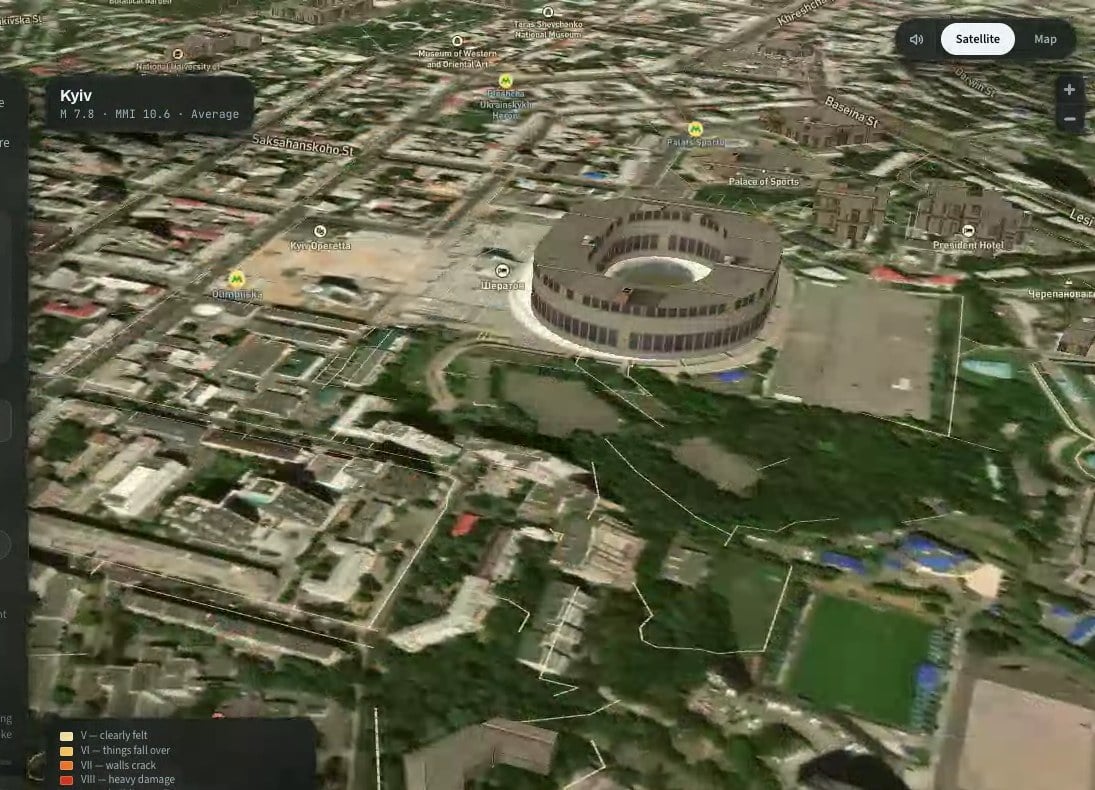
That rule carried me through the tsunami. Then I started on the earthquake and ran into the opposite problem. Mapbox GL JS will draw a city in 3D for you: turn on a fill-extrusion layer and every footprint in the vector tiles rises to its real height.
It looks good until you try to make one of those buildings fall down, and you find out that the map's 3D is a rendering trick, not a scene. There are no objects to grab, rotate or break. Things that lie on the ground and things that have height turned out to need two different techniques, and this guide covers both.
Part 1 builds the ground layer. You'll set up a grid aligned to the map's own tiles, load real elevation data into it, run a flood fill that respects hills and valleys, hand the canvas to the map as a raster source, write pixels into it every frame, layer video textures on top with canvas compositing modes, and move the camera into the scene.
Part 2 adds height. You'll pull building footprints and heights out of the map's tiles, make the extrusions look like buildings, decide which ones fall from the magnitude and distance, animate the collapse without rebuilding any layers, set up a three.js custom layer inside the map's own WebGL context, turn a footprint into a box that tips over, throw debris and dust, and shake the camera.
At the end we'll go through the mistakes from both halves, several of which produce no error message and cost me a day each.
Prerequisites
You should be comfortable with JavaScript, requestAnimationFrame, and the basics of the 2D canvas API: getContext("2d"), drawImage, and ImageData.
You don't need any background in web maps. Everything map-specific is explained where it comes up.
Part 2 also assumes you've used three.js at least once: meshes, materials, a scene and a camera. If you haven't, the three.js fundamentals are enough to follow along, and the parts that interact with the map are explained in full.
The examples use Mapbox GL JS, which is what runs on HazardSim. You'll need a free Mapbox access token for the base map and the vector tiles. Every API used here also exists in MapLibre GL JS, the open-source fork, under the same names. The one place the two differ is called out in Part 2.
Table of Contents
Part 1: Drawing on the Ground
The first half of this guide is about anything that belongs to the surface of the map: water, fire spread, a smoke stain, or a shockwave. The technique is one idea applied carefully, and the next seven steps build it up from a grid to a camera move.
The Core Idea: Map Space, Not Screen Space
A web map is a camera looking at a surface. When the user drags, zooms, tilts or rotates, the camera moves and the surface stays where it is. Roads, buildings, and your flood all belong to the surface, so the camera has to transform them together.
A canvas placed over the map's DOM element is attached to the camera, not to the surface. Think of it as a sheet of glass in front of the lens. Whatever you draw on it stays where you drew it while the world moves underneath.
At a top-down zoom with no rotation, you can fake alignment by reprojecting your points every frame, and it almost works. Add pitch and it falls apart: a flat sprite has no perspective, no foreshortening, and nothing in front of or behind it.
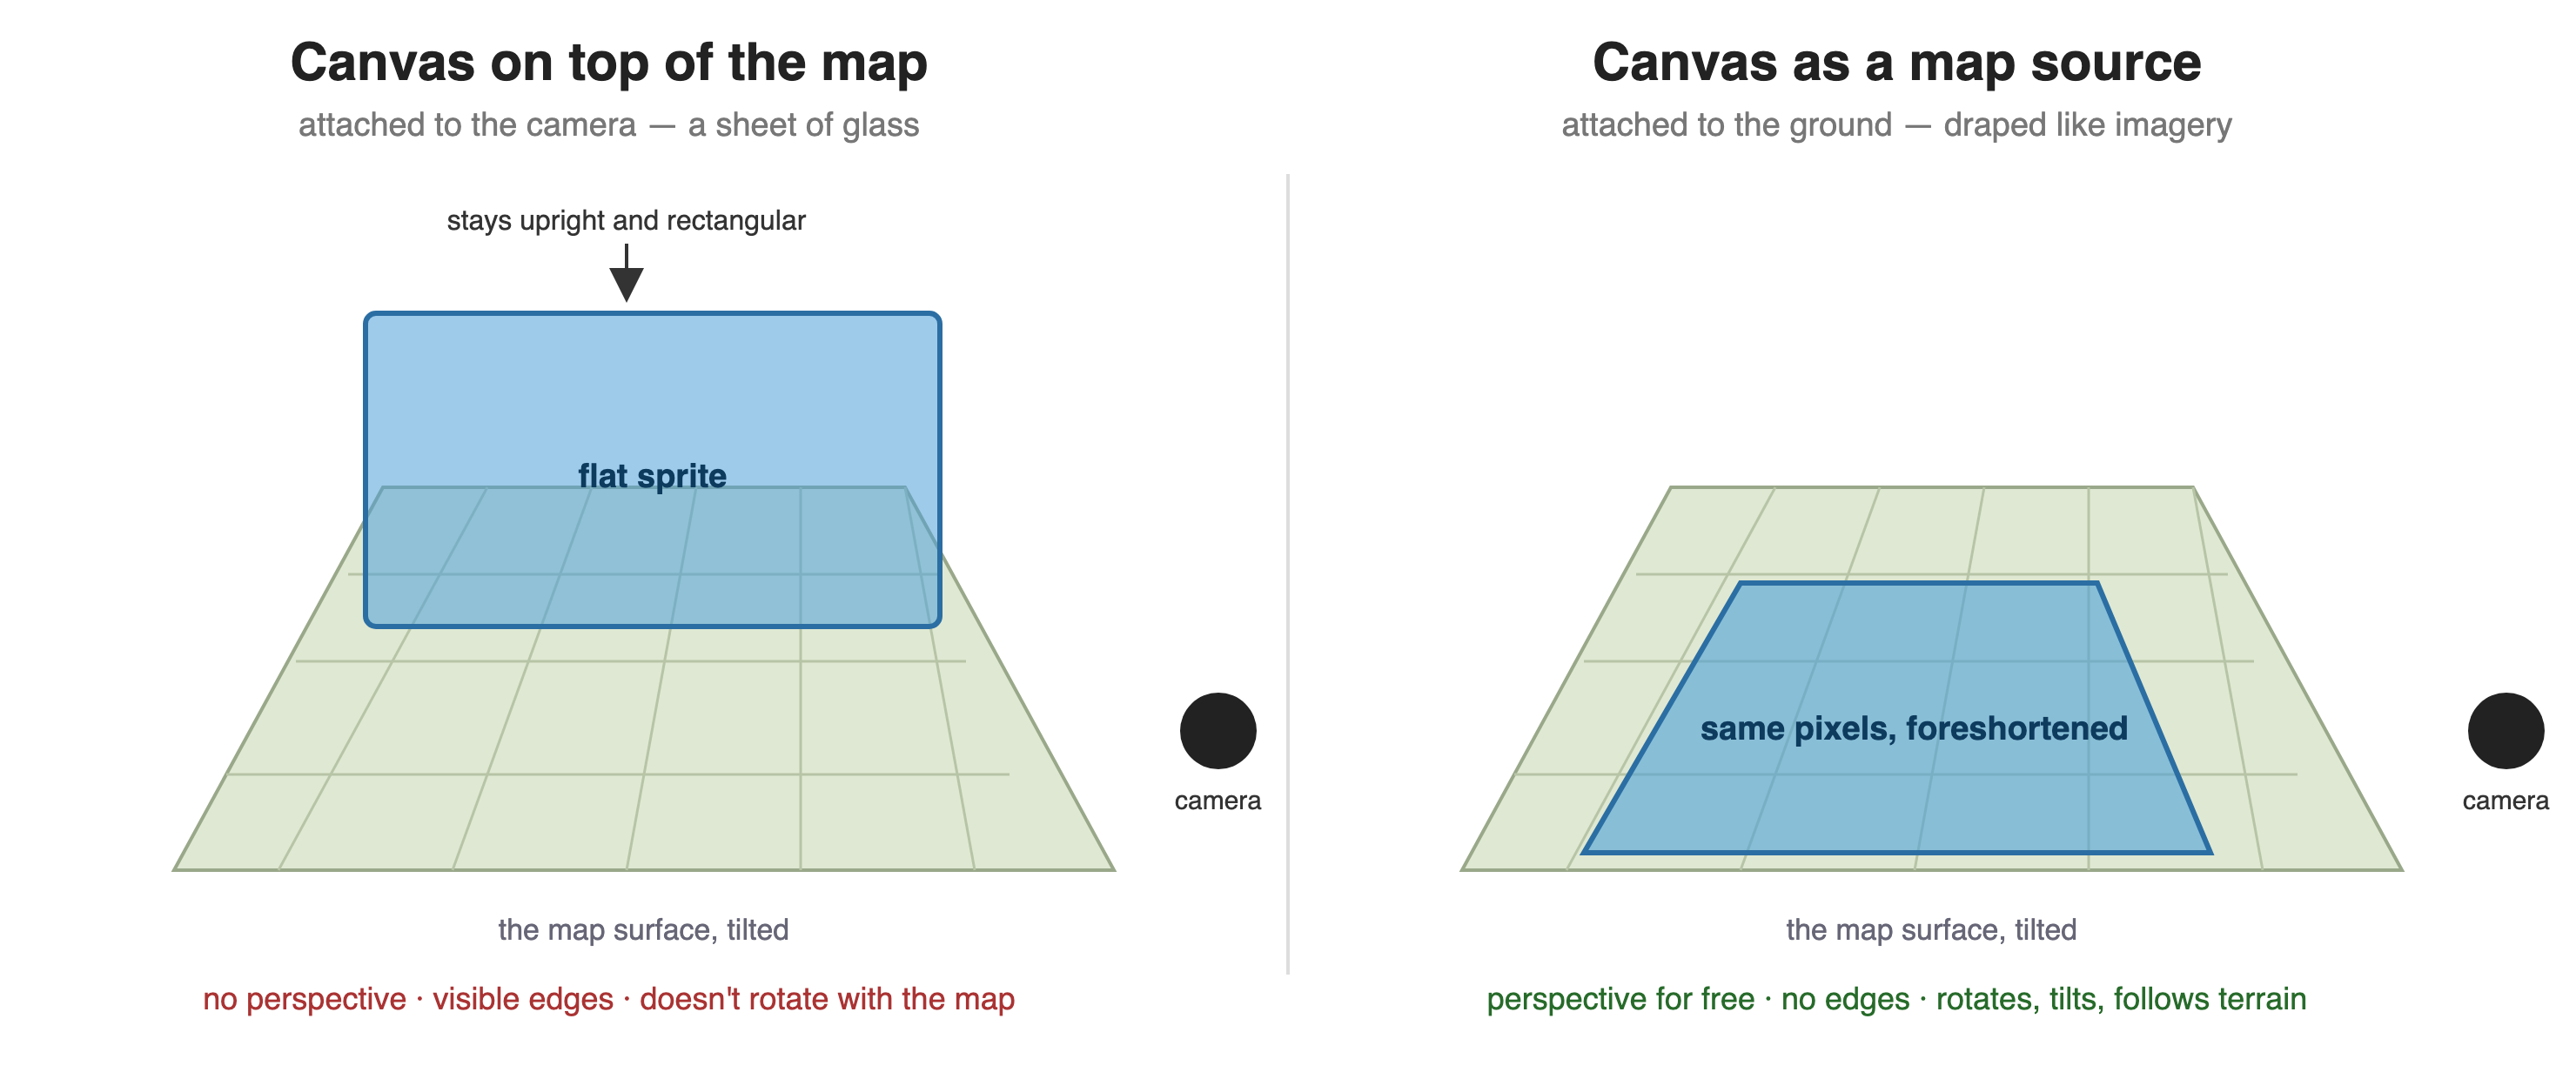
The fix is to give your canvas to the map as a data source. Mapbox GL JS has a canvas source type. You pass it a canvas element and four geographic corners, and from then on the map drapes that canvas over the rectangle the same way it drapes satellite imagery. Rotate the map and the canvas rotates. Tilt it and the canvas foreshortens. Turn on 3D terrain and the canvas follows the hills.
Once the drawing surface lives in map space, several hard problems disappear. The rest of this handbook is about what you can do with that.
Step 1: Choose a Grid Aligned to Map Tiles
Your simulation needs a grid: a 2D array of cells, each holding elevation, water depth, or whatever your model tracks. The decision that makes everything downstream simpler is to align that grid to the map's own tile pyramid.
Web maps use the Web Mercator projection, cut into 256×256-pixel tiles at zoom levels 0 to 22. At zoom z the world is 2^z tiles wide. If one grid cell is exactly one tile pixel at some zoom, converting between grid indices and longitude/latitude takes four short functions, and every dataset that ships as tiles (elevation, population, imagery) drops into your grid without resampling.
Here are the four conversions. lon2x and lat2y return fractional tile coordinates. Multiply by 256 to get pixels.
function lon2x(lon, z) {
  return (lon + 180) / 360 * Math.pow(2, z);
}

function lat2y(lat, z) {
  const rad = lat * Math.PI / 180;
  return (1 - Math.log(Math.tan(rad) + 1 / Math.cos(rad)) / Math.PI) / 2 * Math.pow(2, z);
}

function x2lon(x, z) {
  return x / Math.pow(2, z) * 360 - 180;
}

function y2lat(y, z) {
  const n = Math.PI - 2 * Math.PI * y / Math.pow(2, z);
  return 180 / Math.PI * Math.atan(0.5 * (Math.exp(n) - Math.exp(-n)));
}
Next, pick the zoom. You want the area of interest to fit in a grid that's fine enough to look smooth but small enough to iterate over sixty times a second. In HazardSim, I start at zoom 15 and step down until the bounding box fits in roughly 780 pixels across and under about 620,000 cells:
function chooseZoom(bbox) {
  for (let z = 15; z >= 8; z--) {
    const pw = (lon2x(bbox.e, z) - lon2x(bbox.w, z)) * 256;
    const ph = (lat2y(bbox.s, z) - lat2y(bbox.n, z)) * 256;
    if (pw <= 780 && pw * ph <= 620000) return z;
  }
  return 8;
}
With the zoom chosen, snap the bounding box outward to whole tiles. That rectangle is what your canvas will cover, and those are the tiles you'll download:
function gridFor(bbox) {
  const z = chooseZoom(bbox);
  const x0 = Math.floor(lon2x(bbox.w, z)), x1 = Math.floor(lon2x(bbox.e, z));
  const y0 = Math.floor(lat2y(bbox.n, z)), y1 = Math.floor(lat2y(bbox.s, z));
  const nx = x1 - x0 + 1, ny = y1 - y0 + 1;
  const latMid = (bbox.n + bbox.s) / 2;

  return {
    z, x0, y0, nx, ny,
    W: nx * 256,
    H: ny * 256,
    // metres per cell at this latitude and zoom
    cellM: 156543.03392 * Math.cos(latMid * Math.PI / 180) / Math.pow(2, z),
    // exact geographic corners of the snapped rectangle
    corners: {
      w: x2lon(x0, z), e: x2lon(x1 + 1, z),
      n: y2lat(y0, z), s: y2lat(y1 + 1, z),
    },
  };
}
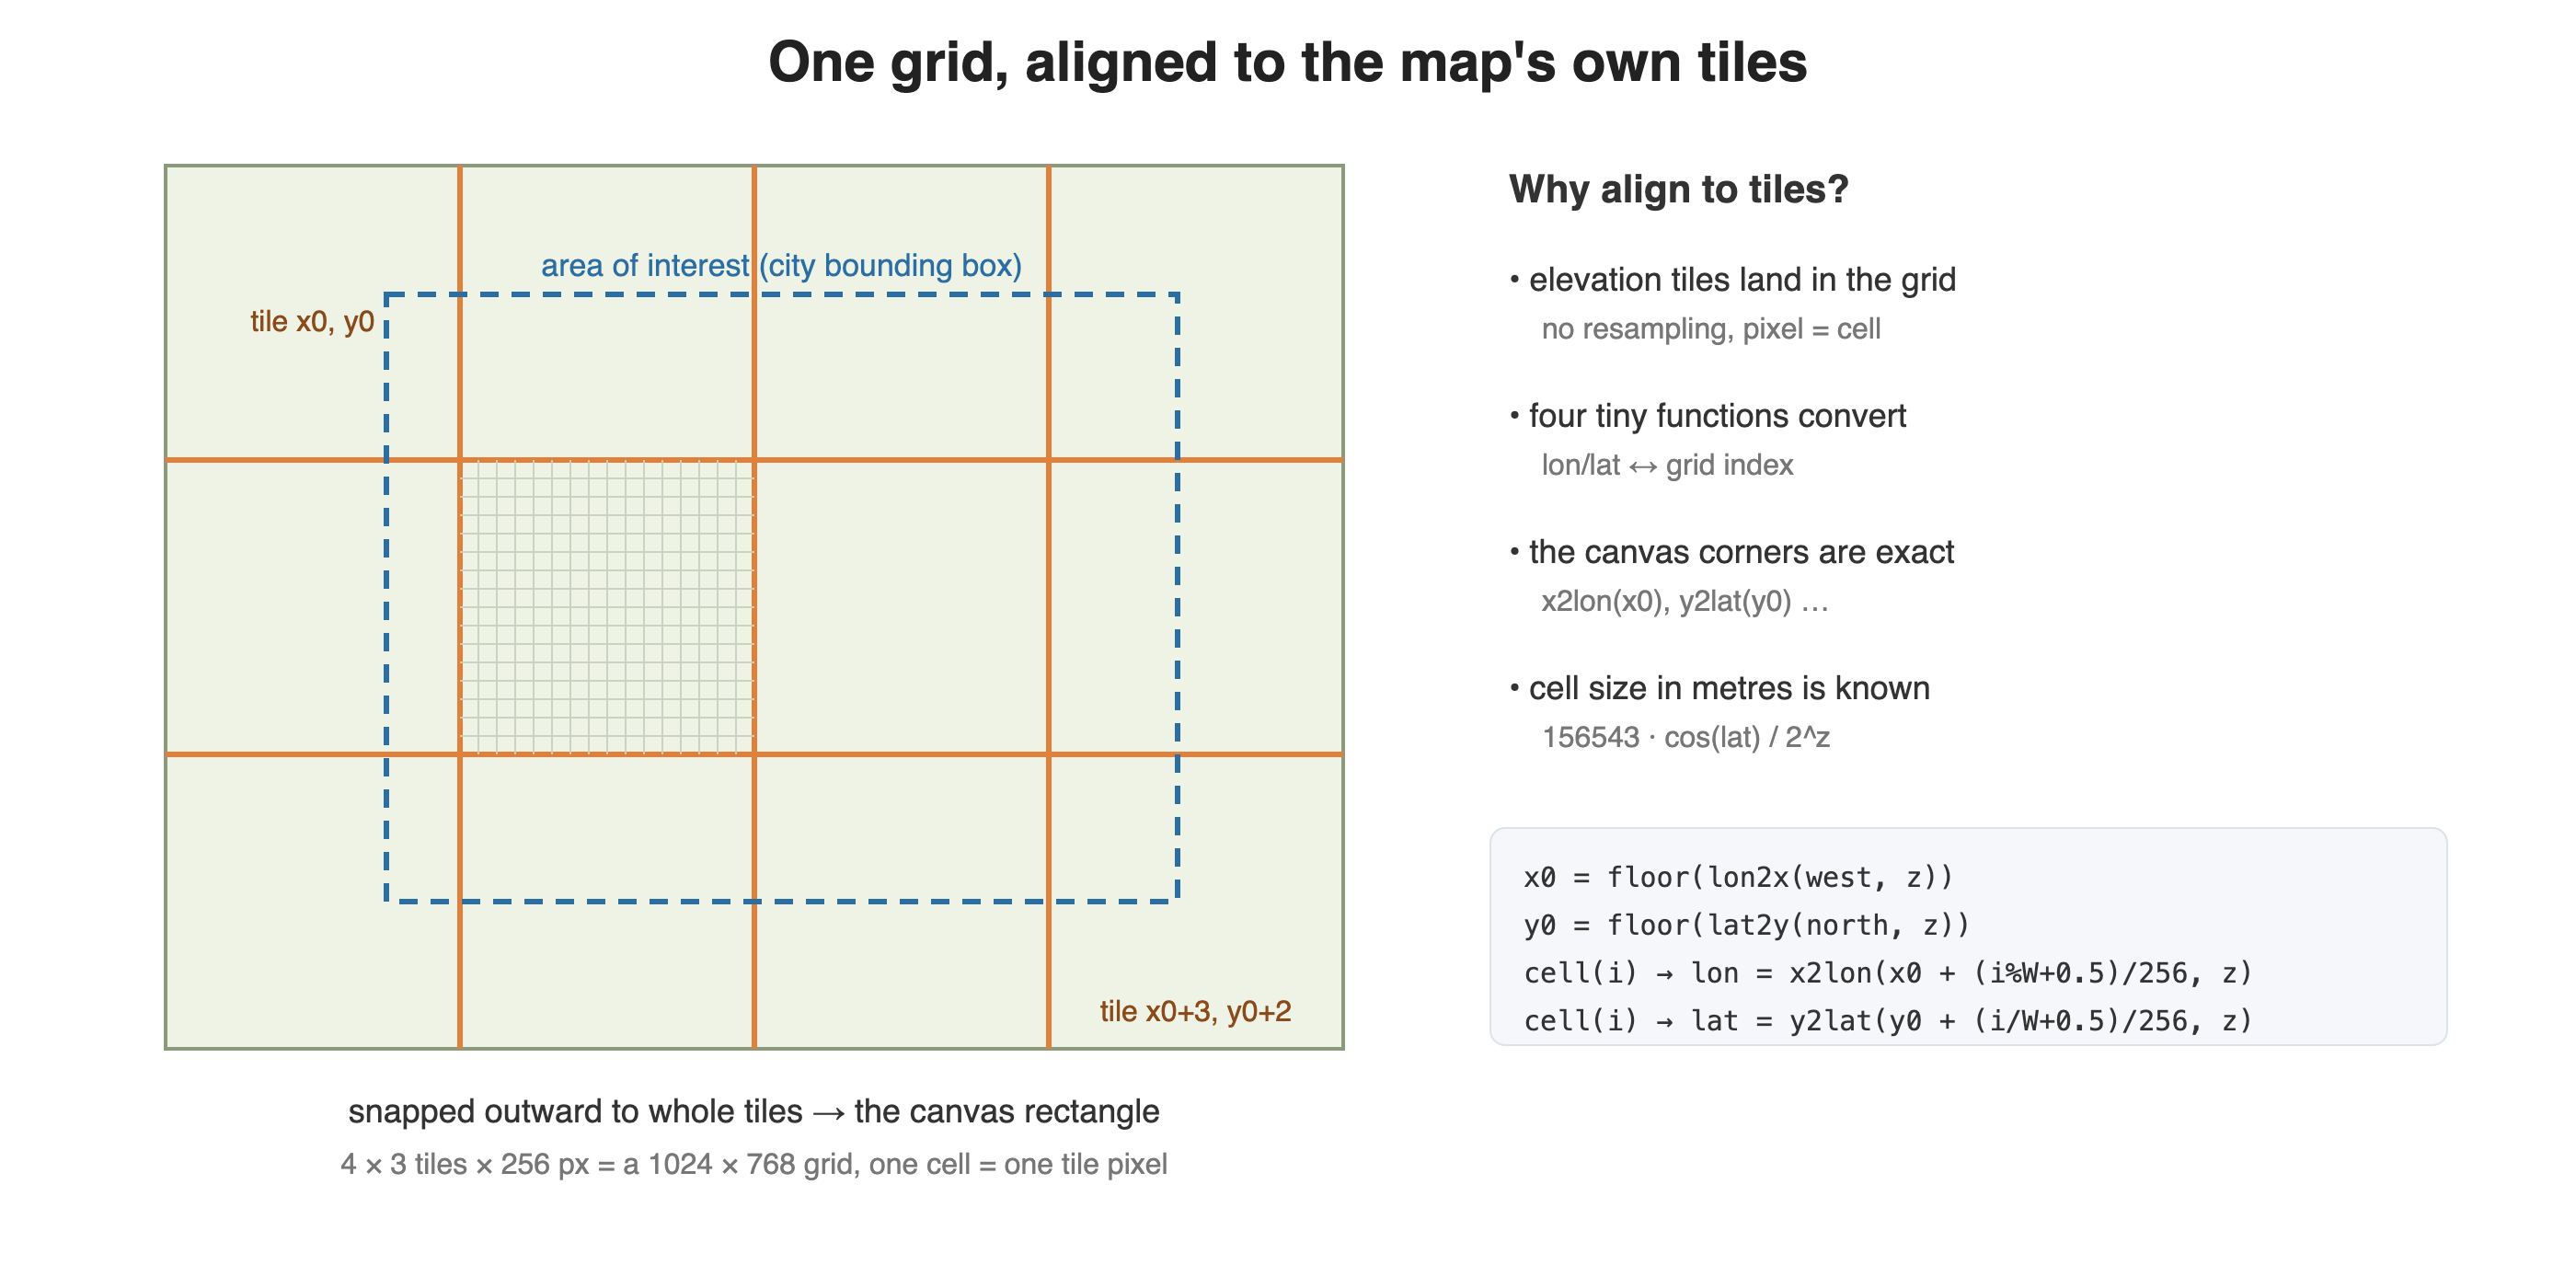
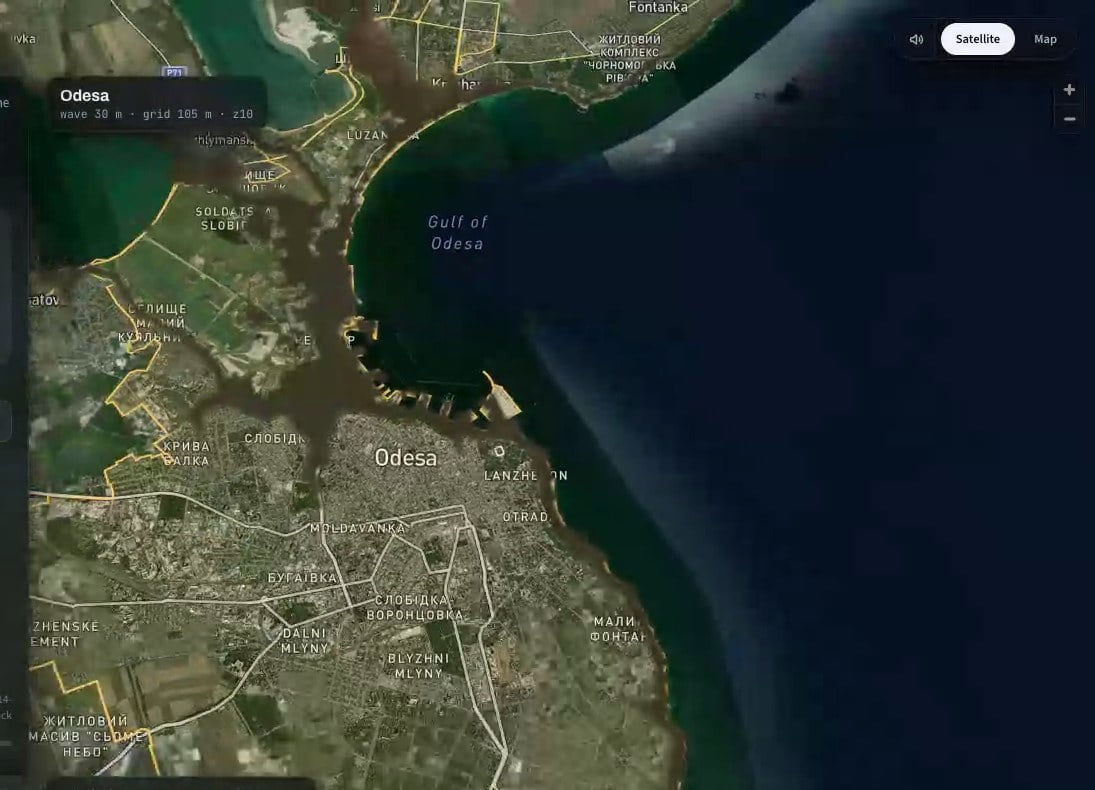
Keep cellM around. You'll need it to turn "the wave has travelled 400 metres" into "the wave has travelled 3.8 cells". For Odesa, the city in most of the screenshots here, the grid ends up at zoom 10 with 105-metre cells.
Step 2: Load Real Elevation Into the Grid
A flood that ignores hills is a blue blob. What makes a simulation on a real map feel real is real terrain, and terrain is free.
The AWS Open Data program hosts the Mapzen Terrarium elevation tiles. They're ordinary PNGs with height encoded in the pixel colour:
height_m = R * 256 + G + B / 256 - 32768
Because the grid is tile-aligned, loading elevation means fetching the tiles, drawing them onto one big canvas in their natural positions, reading the pixels back, and decoding. Nothing is resampled. The grid cell and the elevation sample are the same pixel.
function terrariumUrl(z, x, y) {
  return `https://s3.amazonaws.com/elevation-tiles-prod/terrarium/${z}/${x}/${y}.png`;
}

function loadImage(url) {
  return new Promise((resolve, reject) => {
    const img = new Image();
    img.crossOrigin = "anonymous";
    img.onload = () => resolve(img);
    img.onerror = reject;
    img.src = url;
  });
}

async function loadElevation(grid) {
  const cv = document.createElement("canvas");
  cv.width = grid.W;
  cv.height = grid.H;
  const cx = cv.getContext("2d", { willReadFrequently: true });

  const jobs = [];
  for (let iy = 0; iy < grid.ny; iy++) {
    for (let ix = 0; ix < grid.nx; ix++) {
      jobs.push(
        loadImage(terrariumUrl(grid.z, grid.x0 + ix, grid.y0 + iy))
          .then(img => cx.drawImage(img, ix * 256, iy * 256))
      );
    }
  }
  await Promise.all(jobs);

  const d = cx.getImageData(0, 0, grid.W, grid.H).data;
  const elev = new Float32Array(grid.W * grid.H);
  for (let i = 0; i < elev.length; i++) {
    const o = i * 4;
    elev[i] = d[o] * 256 + d[o + 1] + d[o + 2] / 256 - 32768;
  }
  return elev;
}
crossOrigin = "anonymous" is required. Without it the canvas becomes "tainted" and getImageData throws. The Terrarium bucket sends the right CORS headers, so this works as written.
Since you already have a Mapbox token, you can use Mapbox's own Terrain-RGB tiles instead. The URL is https://api.mapbox.com/v4/mapbox.terrain-rgb/{z}/{x}/{y}.pngraw?access_token=… and the decode formula is different:
// Mapbox Terrain-RGB
elev[i] = -10000 + (d[o] * 65536 + d[o + 1] * 256 + d[o + 2]) * 0.1;
HazardSim supports both and switches with a config flag. Terrain-RGB is cleaner data with fewer spikes. Terrarium is free of per-tile billing. For a tutorial, I'd start with Terrarium.
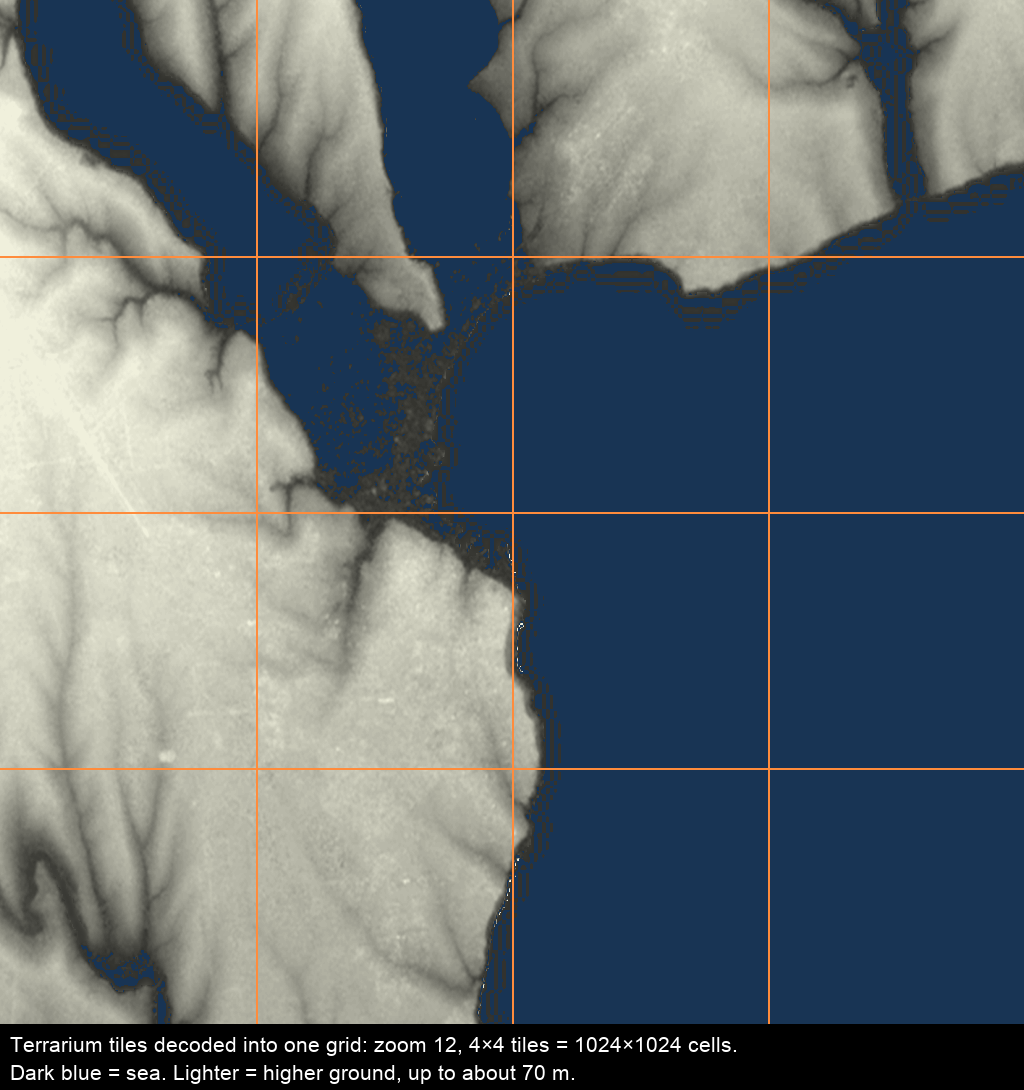
Two practical notes. Terrarium data has occasional single-pixel spikes, and a 3×3 median pass over cells that differ from all their neighbours by more than a few metres cleans them up. And cells at or below zero are sea, except where they aren't, like in the Netherlands, New Orleans, or Death Valley. I treat elev <= 0 as sea only when the cell connects to the map edge through other sea cells. That handles the common cases.
Step 3: Attach a Canvas as a Map Source
Now the central move. Create a canvas the size of your grid and register it with the map as a canvas source whose four corners are the snapped rectangle from Step 1.
<div id="map"></div>
<canvas id="floodcanvas" width="10" height="10" style="display:none"></canvas>
mapboxgl.accessToken = "YOUR_MAPBOX_TOKEN";

const map = new mapboxgl.Map({
  container: "map",
  style: "mapbox://styles/mapbox/satellite-streets-v12",
  center: [30.73, 46.48],
  zoom: 11,
});

const fc = document.getElementById("floodcanvas");
const fctx = fc.getContext("2d");
let fimg = null;

function attachCanvas(grid) {
  fc.width = grid.W;
  fc.height = grid.H;
  fimg = fctx.createImageData(grid.W, grid.H);

  const c = grid.corners;
  const coords = [[c.w, c.n], [c.e, c.n], [c.e, c.s], [c.w, c.s]];

  if (map.getSource("flood")) {
    map.getSource("flood").setCoordinates(coords);
    return;
  }
  map.addSource("flood", {
    type: "canvas",
    canvas: "floodcanvas",
    coordinates: coords,
    animate: true,
  });
  map.addLayer({
    id: "flood",
    type: "raster",
    source: "flood",
    paint: {
      "raster-opacity": 0.94,
      "raster-resampling": "linear",
      "raster-fade-duration": 0,
    },
  });
}
Three options matter here:
animate: truetells Mapbox GL to re-upload the canvas as a texture every frame. Without it, the animation freezes on the first frame."raster-resampling": "linear"blends between cells when the user zooms in past your grid resolution. With 105-metre cells at a city zoom, it's the difference between water and a pixel-art game."raster-fade-duration": 0turns off the cross-fade Mapbox GL applies to raster tiles. You're redrawing every frame, and a fade only smears it.
The canvas is display:none because the map reads it directly. It never needs to be visible in the DOM.
From here on, anything you write into fimg and push with fctx.putImageData(fimg, 0, 0) shows up on the map in the right place, at any pitch and bearing, draped over terrain if terrain is on. The rendering problem has turned into a pixel-array problem.
Step 4: Simulate a Flood That Respects the Terrain
A tsunami doesn't flood everything below the wave height. Water has to get there. It enters from the sea, flows over low ground, and stops where the ground rises above the water level, even if there's lower ground on the far side of a ridge. That's a connectivity problem, and breadth-first search is the tool for it.
First, a distance field: how far is each cell from the coast? Seed the queue with every sea cell adjacent to land, then expand into the sea. You'll use this to animate the wave approaching, and the land-side equivalent to animate it spreading inland.
function seaDistance(grid, sea) {
  const { W, H, cellM } = grid;
  const N = W * H;
  const dist = new Float32Array(N).fill(-1);
  const q = new Int32Array(N);
  let head = 0, tail = 0;

  // seed: sea cells that touch land
  for (let i = 0; i < N; i++) {
    if (!sea[i]) continue;
    const x = i % W, y = (i / W) | 0;
    const touchesLand =
      (x > 0 && !sea[i - 1]) || (x < W - 1 && !sea[i + 1]) ||
      (y > 0 && !sea[i - W]) || (y < H - 1 && !sea[i + W]);
    if (touchesLand) { dist[i] = 0; q[tail++] = i; }
  }

  // expand
  while (head < tail) {
    const c = q[head++];
    const cx = c % W, cy = (c / W) | 0;
    for (let dy = -1; dy <= 1; dy++) {
      for (let dx = -1; dx <= 1; dx++) {
        if (!dx && !dy) continue;
        const nx = cx + dx, ny = cy + dy;
        if (nx < 0 || ny < 0 || nx >= W || ny >= H) continue;
        const n = ny * W + nx;
        if (!sea[n] || dist[n] >= 0) continue;
        dist[n] = dist[c] + (dx && dy ? cellM * Math.SQRT2 : cellM);
        q[tail++] = n;
      }
    }
  }
  return dist;
}
The flood is the same search in the other direction, with one extra rule: a cell is reachable only if the water surface is above its ground. waveH is the wave height at the shore in metres. The water loses height as it travels inland, and a linear decay is enough to look right:
function floodFill(grid, elev, sea, waveH) {
  const { W, H, cellM } = grid;
  const N = W * H;
  const depth = new Float32Array(N);       // metres of water above ground
  const reach = new Float32Array(N).fill(-1); // distance from shore, metres
  const q = new Int32Array(N);
  let head = 0, tail = 0;

  for (let i = 0; i < N; i++) {
    if (!sea[i]) continue;
    const x = i % W, y = (i / W) | 0;
    const nb = [i - 1, i + 1, i - W, i + W];
    for (const n of nb) {
      if (n < 0 || n >= N || sea[n] || reach[n] >= 0) continue;
      if ((n === i - 1 && x === 0) || (n === i + 1 && x === W - 1)) continue;
      reach[n] = 0;
      q[tail++] = n;
    }
  }

  const decayPerM = waveH / 12000; // loses its height over ~12 km

  while (head < tail) {
    const c = q[head++];
    const level = waveH - reach[c] * decayPerM;
    const d = level - elev[c];
    if (d <= 0) continue;               // ground is above the water here: stop
    depth[c] = d;

    const cx = c % W, cy = (c / W) | 0;
    for (let dy = -1; dy <= 1; dy++) {
      for (let dx = -1; dx <= 1; dx++) {
        if (!dx && !dy) continue;
        const nx = cx + dx, ny = cy + dy;
        if (nx < 0 || ny < 0 || nx >= W || ny >= H) continue;
        const n = ny * W + nx;
        if (sea[n] || reach[n] >= 0) continue;
        reach[n] = reach[c] + (dx && dy ? cellM * Math.SQRT2 : cellM);
        q[tail++] = n;
      }
    }
  }
  return { depth, reach };
}
Run this once per scenario, not per frame. On a 700×500 grid it takes a few milliseconds. The outputs, depth for every cell and reach for how far inland it is, are all the animation needs.
Because the fill follows real elevation, it goes up river valleys and stops at embankments. Multiply the flooded cell count by cellM² and you get a flooded area in square kilometres you can stand behind.
Step 5: Animate by Writing Pixels
The frame loop does one thing. For each flooded land cell, it decides whether the water has arrived yet, and if so, what colour it is.
"Arrived" is a comparison of the cell's reach against a front position F that grows with time. Add some per-cell noise to reach so the front isn't a perfect contour line, and the water starts to look like water:
let t0 = null;
const T_LANDFALL = 3.9;   // seconds until the wave reaches the shore
const T_FULL = 10.9;      // seconds until it reaches its maximum extent

function ease(k) {
  return k <= 0 ? 0 : k >= 1 ? 1 : 1 - Math.pow(1 - k, 2.2);
}

function frame(now) {
  if (t0 === null) t0 = now;
  const t = (now - t0) / 1000;
  const d = fimg.data;
  const { W, H } = grid;

  // how far inland the front has got, in metres
  const F = t < T_LANDFALL
    ? -1e9
    : maxReach * ease((t - T_LANDFALL) / (T_FULL - T_LANDFALL));

  for (let i = 0; i < W * H; i++) {
    const o = i * 4;
    if (sea[i] || depth[i] <= 0) { d[o + 3] = 0; continue; }

    const arrival = reach[i] + noise[i] * 180;   // ±90 m of jitter
    if (arrival > F) { d[o + 3] = 0; continue; }

    const age = (F - arrival) / 150;             // how long the cell has been under
    const dp = depth[i];

    // base colour: shallow is lighter, deep is darker
    let r = 40 + Math.max(0, 60 - dp * 10);
    let g = 70 + Math.max(0, 50 - dp * 8);
    let b = 95 + Math.max(0, 40 - dp * 6);
    let a = dp < 0.5 ? 215 + dp * 60 : 245;

    // the leading edge is foam: push toward white for the first moments
    if (age < 1.4) {
      const k = Math.pow(1 - age / 1.4, 2) * 0.8;
      r += (240 - r) * k; g += (246 - g) * k; b += (246 - b) * k;
    }

    d[o] = r; d[o + 1] = g; d[o + 2] = b; d[o + 3] = a;
  }

  fctx.putImageData(fimg, 0, 0);
  if (t < T_FULL + 3) requestAnimationFrame(frame);
}

requestAnimationFrame(frame);
noise is a Float32Array of random values in [-0.5, 0.5] generated once per run. maxReach is the largest reach value among flooded cells.
There are two performance points: A 700×500 grid is 350,000 cells, and this loop runs at 60 fps on my laptop and around 30 fps on a mid-range phone. If you need more, iterate only over the list of flooded land cells (collect the indices once after floodFill) instead of the whole grid. In a coastal city, that's usually a quarter of the cells. And keep fimg between frames. Calling createImageData every frame is the first thing a profiler will point at.
If you stop here, you have a working, terrain-aware simulation. The rest is about making it look like footage instead of a diagram.
Step 6: Layer Video Textures With Canvas Compositing
Flat colour reads as a diagram. Real water has texture that moves. The cheapest way to get that is to drape a looping video of real water over the flooded area, and the restriction "over the flooded area only" comes free from two canvas compositing modes:
source-atopdraws the new image only where the destination already has pixels. Draw a video onto the flood canvas withsource-atopand it appears on water only. Dry land stays untouched, because dry land is transparent.destination-inkeeps the destination only where the new image has pixels. Draw a black-and-transparent mask onto a buffer withdestination-in, and the buffer is cropped to the mask's shape.
You need a hidden <video> (muted, looping, and playsInline. You need all three, or mobile Safari refuses to autoplay) and one scratch canvas the size of the grid:
const vid = document.createElement("video");
vid.muted = true; vid.loop = true; vid.playsInline = true;
vid.setAttribute("muted", ""); vid.setAttribute("playsinline", "");
vid.src = "/fx/water.webm";
vid.style.cssText = "position:absolute;width:1px;height:1px;opacity:0;pointer-events:none";
document.body.appendChild(vid);
vid.load();

const buf = document.createElement("canvas");
buf.width = grid.W; buf.height = grid.H;
const bctx = buf.getContext("2d");

function drawWaterTexture(mud) {
  if (vid.readyState < 2) return;         // not enough data yet: skip, don't block
  if (vid.paused) vid.play().catch(() => {});

  // 1. video into the scratch buffer, stretched to the grid
  bctx.globalCompositeOperation = "source-over";
  bctx.clearRect(0, 0, grid.W, grid.H);
  bctx.drawImage(vid, 0, 0, grid.W, grid.H);

  // 2. tint it, only where the video is (everywhere, at this point)
  bctx.globalCompositeOperation = "source-atop";
  bctx.globalAlpha = 0.5 + 0.38 * mud;
  bctx.fillStyle = `rgb(${28 + 108 * mud | 0}, ${112 - 10 * mud | 0}, ${178 - 126 * mud | 0})`;
  bctx.fillRect(0, 0, grid.W, grid.H);
  bctx.globalAlpha = 1;

  // 3. crop the buffer to land cells, so the open sea keeps its own colour
  bctx.globalCompositeOperation = "destination-in";
  bctx.drawImage(landMask, 0, 0);

  // 4. onto the flood canvas, only where there's already water
  fctx.save();
  fctx.globalCompositeOperation = "source-atop";
  fctx.globalAlpha = 0.8;
  fctx.drawImage(buf, 0, 0);
  fctx.restore();
}
Call this right after fctx.putImageData(fimg, 0, 0) in the frame loop. Step 4 is where it pays off. Because the flood canvas is transparent wherever there's no water, source-atop puts the texture exactly inside the flood outline, following every bay and valley the BFS found, with no per-pixel work on your side.
landMask is a canvas you build once per run: white where sea[i] is false, transparent elsewhere. Without it the texture also covers the open sea, and the whole gulf turns the colour of the flood. I shipped that version for about an hour before I noticed.
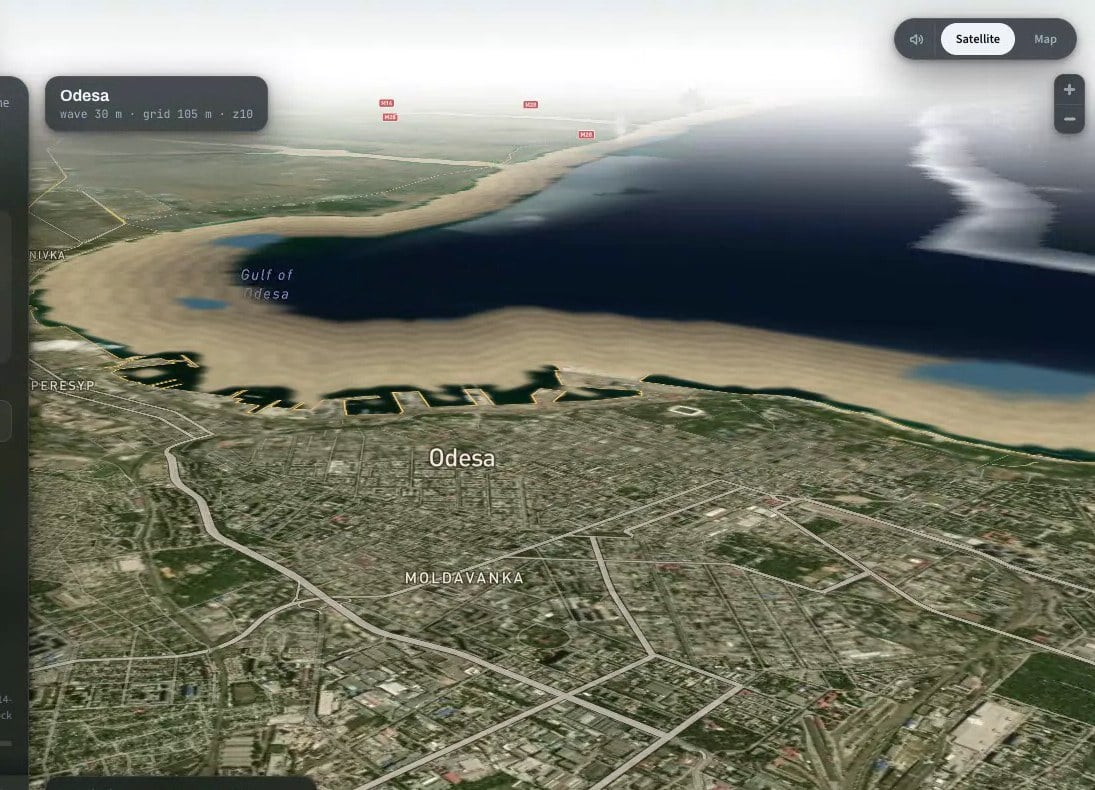
The mud parameter is a time ramp from 0 to 1. Tsunami water arrives as seawater and turns dark brown as it picks up sediment off the land. Interpolating the tint from sea blue to mud brown over a few seconds after landfall gives you that for free.
The first time I built this, I had baked a brown grade into the video file itself, and no amount of tinting could make the water blue at the start. Keep the source footage neutral and do colour in code.
The same destination-in trick gives you a depth-driven darkening (a mask whose alpha is proportional to depth[i], filled with a dark colour) and a foam band along the moving front (a mask whose alpha is a Gaussian of reach[i] - F, filled with a second video of churning foam). Each is a few lines, and each one makes the water read a little more as a volume and a little less as a tint.
Step 7: Move the Camera Into the Scene
A top-down map is an illustration. Tilt the camera and the same pixels become a place. The flood canvas is draped on the ground, so it foreshortens correctly. Your only job is to point the camera somewhere worth looking at.
For a tsunami, that means standing on the shore near the city, looking out to sea, and watching it come in. "Near the city" is the coastline cell closest to the map centre. "Out to sea" is the average direction to nearby sea cells from that point. Compute it locally rather than for the whole coastline, or a curved bay will point your camera at the wrong horizon. I found that out with Odesa, where the citywide average pointed the camera at empty fields next to the airport.
function shoreCamera(grid, sea, center) {
  const { W, H, z, x0, y0, cellM } = grid;

  // 1. nearest coastline cell to the map centre
  let best = -1, bestD = Infinity;
  for (let i = 0; i < W * H; i++) {
    if (!sea[i]) continue;
    const x = i % W, y = (i / W) | 0;
    const coast = (x > 0 && !sea[i - 1]) || (x < W - 1 && !sea[i + 1]) ||
                  (y > 0 && !sea[i - W]) || (y < H - 1 && !sea[i + W]);
    if (!coast) continue;
    const lng = x2lon(x0 + (x + 0.5) / 256, z), lat = y2lat(y0 + (y + 0.5) / 256, z);
    const d = (lng - center.lng) ** 2 + (lat - center.lat) ** 2;
    if (d < bestD) { bestD = d; best = i; }
  }
  const sx = best % W, sy = (best / W) | 0;

  // 2. local seaward direction: average offset to sea cells within ~2.5 km
  const r = Math.max(6, Math.round(2500 / cellM));
  let vx = 0, vy = 0;
  for (let dy = -r; dy <= r; dy++) {
    for (let dx = -r; dx <= r; dx++) {
      const x = sx + dx, y = sy + dy;
      if (x < 0 || y < 0 || x >= W || y >= H || !sea[y * W + x]) continue;
      const len = Math.hypot(dx, dy);
      if (len < 1 || len > r) continue;
      vx += dx / len; vy += dy / len;
    }
  }
  const len = Math.hypot(vx, vy) || 1;
  const east = vx / len, north = -vy / len;   // grid y grows southward

  const shoreLng = x2lon(x0 + (sx + 0.5) / 256, z);
  const shoreLat = y2lat(y0 + (sy + 0.5) / 256, z);
  const mLng = 111320 * Math.cos(shoreLat * Math.PI / 180), mLat = 111320;

  return {
    // stand 900 m inland of the shore...
    center: [shoreLng - east * 900 / mLng, shoreLat - north * 900 / mLat],
    // ...facing the sea
    bearing: Math.atan2(east, north) * 180 / Math.PI,
  };
}
Then it's two easeTo calls: dive in before landfall, pull back out before the results appear.
const before = {
  center: map.getCenter(), zoom: map.getZoom(),
  pitch: map.getPitch(), bearing: map.getBearing(),
};
const cam = shoreCamera(grid, sea, map.getCenter());

map.easeTo({
  center: cam.center,
  zoom: Math.min(13.6, before.zoom + 2.8),
  pitch: 72,
  bearing: cam.bearing,
  duration: 1200,
});

setTimeout(() => map.easeTo({ ...before, duration: 2600 }), (T_LANDFALL + 3.2) * 1000);
Here is what those two calls produce. The camera has dropped to a steep pitch above the shore of Odesa and turned to face the Gulf. The sea pulls back first, exposing a wide band of sand, and then the front comes in over the beach and into the port. Everything you see moving is the same flood canvas from Step 3, foreshortened by the camera and draped over the terrain.
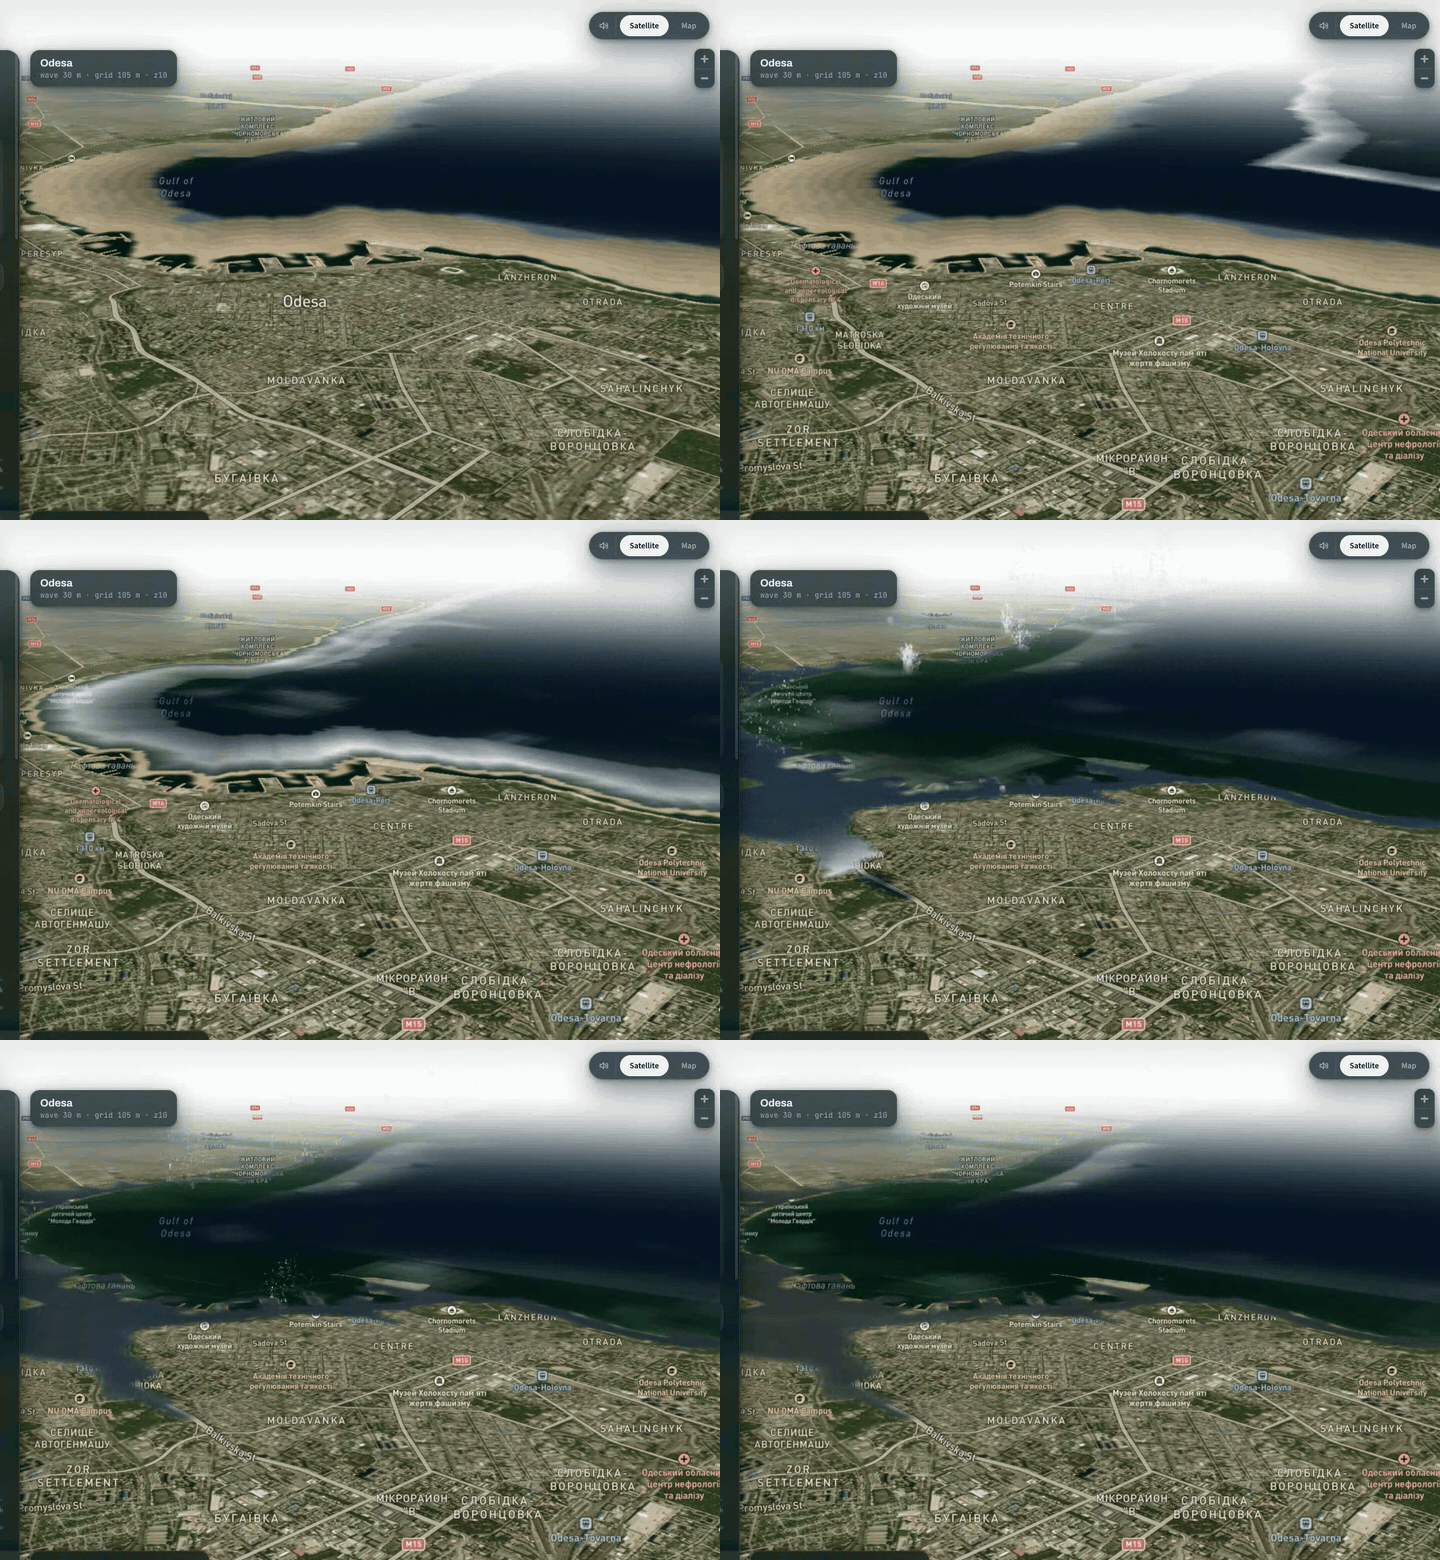
Notice that nothing in the frame loop knows or cares that the camera moved. The loop keeps writing the same pixels into the same canvas, and the map does the rest. That's what Step 3 bought you.
Where the Ground Layer Stops
Everything so far lives on the ground. The flood canvas is the map's own surface, and that's exactly why it works: perspective, rotation and terrain come free. The moment you need something with height, the trick runs out. You can't drape a tower onto a raster.
I learned where that line is the expensive way. I built a real 3D wall of water as a three.js custom layer, and it worked. I also cut it, for a reason worth knowing before you spend the time.
A 30-metre wave seen from 250 metres away covers about 7 degrees of a 37-degree field of view, a fifth of the screen. To make it fill the frame, you have to put the camera a hundred metres from it and nearly on the ground, where satellite imagery smears into mud. The geometry was correct and the shot was bad. Draped water under a pitched camera turned out to read as more water than a correctly-scaled wall did.
So the ground layer stayed a ground layer. But the earthquake scenario had no such escape: a building that collapses has to be an object. That is Part 2.
Part 2: Things with Height
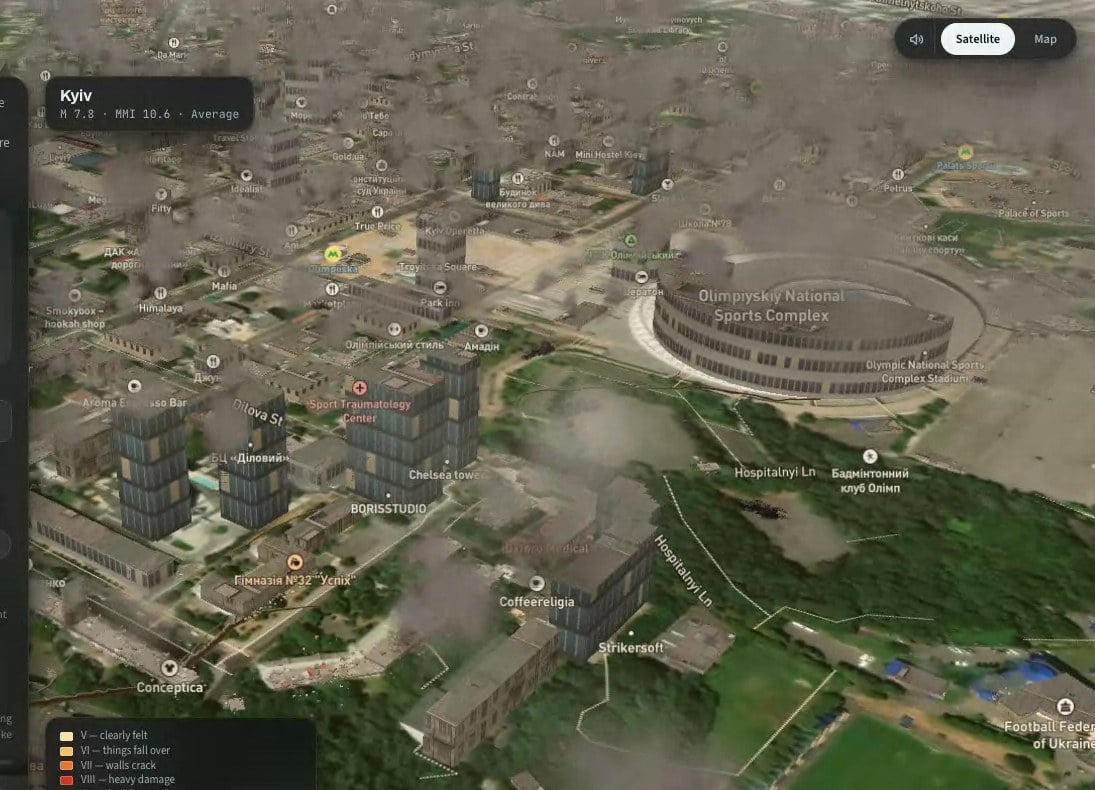
For the earthquake scenario, I needed buildings to fall. This half is what I ended up with after roughly ten rounds of rebuilding it: a mix of map-native extrusions for the thousands of buildings that only need to stand there, and a three.js scene rendered into the map's own WebGL context for the ones that come down.
Both paths read the same vector tiles, share the same depth buffer and move together under every camera move.
Two Kinds of 3D, and Why You Need Both
A fill-extrusion layer is the map engine's own 3D. It's fast, it handles tens of thousands of buildings, it's lit consistently with the rest of the map, and it's driven by data expressions: height from a property, colour from a property, and, the part that matters here, height multiplied by a per-feature state you can change at runtime. What it can't do is move. An extrusion is always a vertical prism standing on the ground.
A custom layer gives you the map's WebGL context and projection matrix every frame and lets you draw whatever you want into it. With three.js on the other end, that means real objects: meshes with position, rotation, and scale, instanced by the thousand, writing into the same depth buffer as the map so that a falling block disappears correctly behind a building that's still standing.
The split that works is simple. Every building is an extrusion. When one is damaged, its extrusion shrinks (that's the per-feature state). When one collapses close enough to the camera that you'd see the difference, the extrusion shrinks to nothing and a three.js object takes its place for the two seconds of the fall. Then the object is replaced with a pile of rubble, also three.js, and the frame rate never notices.
Step 8: Get Buildings Out of the Map's Own Tiles
You don't need a building dataset. The map is already downloading one. Mapbox Streets vector tiles carry a building source layer with a polygon footprint, a height, a min_height for buildings that start above ground, and an extrude flag. querySourceFeatures reads whatever is currently loaded:
function buildingSource(map) {
  const sources = map.getStyle().sources;
  if (sources.composite) return "composite";         // Mapbox styles
  if (sources.openmaptiles) return "openmaptiles";   // MapLibre + OpenMapTiles
  for (const id in sources) if (sources[id].type === "vector") return id;
  return null;
}

function collectBuildings(map, center, kx, ky) {
  const src = buildingSource(map);
  if (!src) return [];
  const feats = map.querySourceFeatures(src, { sourceLayer: "building" });
  const out = [], seen = new Set();

  for (const f of feats) {
    const p = f.properties || {}, g = f.geometry;
    if (!g || p.extrude === "false" || p.underground === "true") continue;

    const polys = g.type === "Polygon" ? [g.coordinates]
                : g.type === "MultiPolygon" ? g.coordinates : null;
    if (!polys || !polys[0] || polys[0][0].length < 4) continue;

    // centroid and bounds of the outer ring
    const ring = polys[0][0], n = ring.length - 1;
    let sx = 0, sy = 0, x0 = Infinity, x1 = -Infinity, y0 = Infinity, y1 = -Infinity;
    for (let j = 0; j < n; j++) {
      const [x, y] = ring[j];
      sx += x; sy += y;
      if (x < x0) x0 = x; if (x > x1) x1 = x;
      if (y < y0) y0 = y; if (y > y1) y1 = y;
    }
    sx /= n; sy /= n;

    // the same building appears once per tile it touches
    const key = sx.toFixed(6) + "," + sy.toFixed(6) + "," + n;
    if (seen.has(key)) continue;
    seen.add(key);

    let h = +(p.height ?? p.render_height);
    if (!(h > 0)) h = 8;                              // no data: assume two storeys
    const mh = Math.min(h, +(p.min_height ?? p.render_min_height) || 0);

    out.push({
      geometry: g, polys, lng: sx, lat: sy, h, mh,
      d: Math.hypot((sx - center.lng) * kx, (sy - center.lat) * ky),   // metres from epicentre
      rf: 0.5 * Math.sqrt(Math.max(4, (x1 - x0) * kx * (y1 - y0) * ky)), // rough radius, metres
    });
  }
  out.sort((a, b) => a.d - b.d);
  return out.slice(0, 9000);
}
kx and ky are metres per degree of longitude and latitude at the city's latitude: 111320 * cos(lat) and 110574. Everything downstream works in metres from the epicentre.
Three things to know about this data. First, querySourceFeatures returns a building once for each tile it intersects, so you have to deduplicate. A rounded centroid plus vertex count makes a good key.
Second, the features have no stable IDs in Mapbox Streets. That matters enormously in Step 11.
Third, you only get what's loaded, which means you have to zoom in to where the buildings are before you collect them, and wait for the tiles to arrive.
In HazardSim, the camera dives in two steps, holds until map.areTilesLoaded() is true and the feature count stops changing between polls, and only then runs collectBuildings. If you collect too early, you get the ten buildings that happened to be in the first tile.
Step 9: Make Extrusions Look Like Buildings
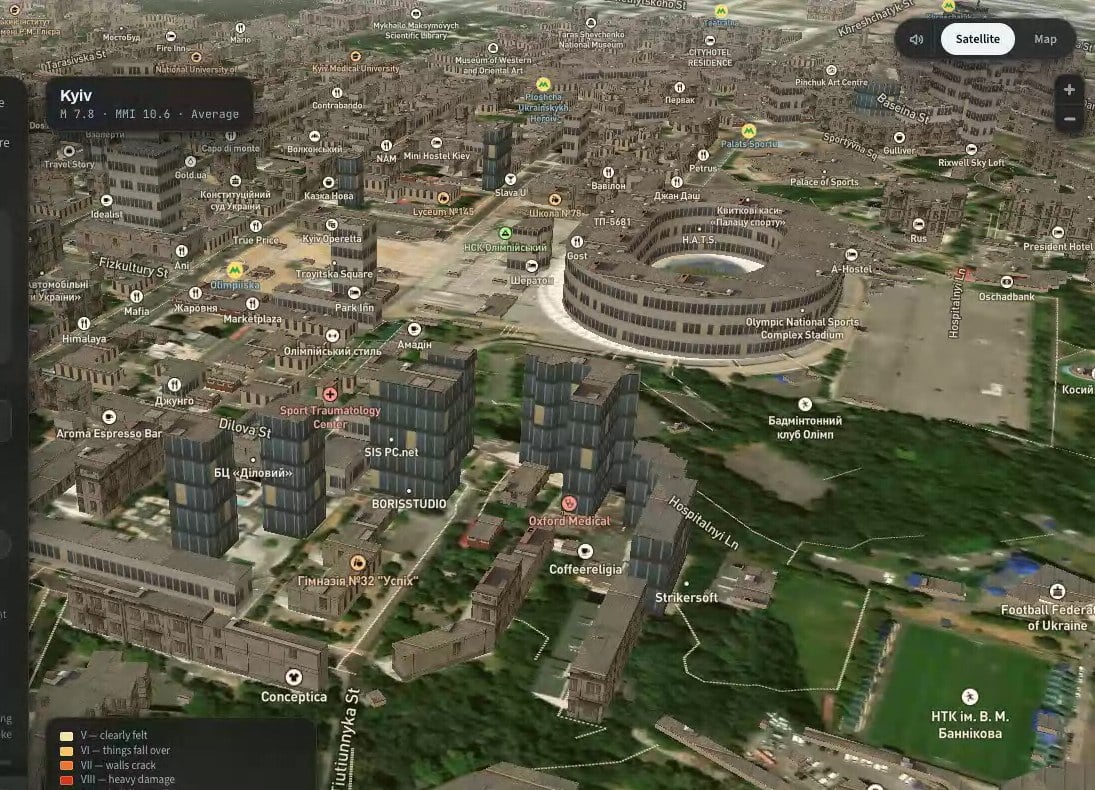
The default extrusion is a flat-shaded box in one colour. It reads as a diagram. The trick that fixes it costs almost nothing: fill-extrusion-pattern takes an image from the style's sprite and tiles it over the walls, and you can add images to the sprite at runtime with map.addImage.
Draw a few façade textures on a canvas (rows of windows on a wall colour, with slight noise so they don't look computer-generated), register them, and pick one per building from its height:
function makeFacade(map, id, wall, glass) {
  const cv = document.createElement("canvas");
  cv.width = 128; cv.height = 64;
  const c = cv.getContext("2d");
  c.fillStyle = wall; c.fillRect(0, 0, 128, 64);

  // four floors of windows, 16px per floor
  for (let f = 0; f < 4; f++) {
    for (let x = 3; x + 6 <= 128; x += 12) {
      const lit = Math.random() < 0.07;
      c.fillStyle = lit ? "#c6b68c" : glass;
      c.fillRect(x, f * 16 + 3, 6, 9);
    }
  }
  // film grain
  const im = c.getImageData(0, 0, 128, 64), d = im.data;
  for (let i = 0; i < d.length; i += 4) {
    const n = (Math.random() - 0.5) * 12;
    d[i] += n; d[i + 1] += n; d[i + 2] += n;
  }
  map.addImage(id, im);
}

makeFacade(map, "fac-glass",  "#566a78", "#3c4e5c");
makeFacade(map, "fac-light",  "#cdc8be", "#364048");
makeFacade(map, "fac-brick",  "#8a5a44", "#2e2a26");
Then the layer. Height and base are expressions, and both are multiplied by a feature-state value k that defaults to 1. That multiplier is the whole collapse mechanism, so it goes in now:
const H  = ["coalesce", ["get", "height"], ["get", "render_height"], 8];
const MH = ["coalesce", ["get", "min_height"], ["get", "render_min_height"], 0];
const K  = ["coalesce", ["feature-state", "k"], 1];

function addBuildingLayers(map, source, sourceLayer, before) {
  const common = { type: "fill-extrusion", source, minzoom: 13 };
  if (sourceLayer) {
    common["source-layer"] = sourceLayer;
    common.filter = ["all", ["!=", ["get", "extrude"], "false"], ["!=", ["get", "underground"], "true"]];
  }
  map.addLayer({
    ...common, id: "bld-walls",
    paint: {
      "fill-extrusion-pattern": ["case",
        [">=", H, 45], "fac-glass",
        [">=", H, 14], "fac-light",
        "fac-brick"],
      "fill-extrusion-height": ["*", H, K],
      "fill-extrusion-base":   ["*", MH, K],
      "fill-extrusion-opacity": 1,
    },
  }, before);
  // a thin second extrusion on top gives the roof its own texture
  map.addLayer({
    ...common, id: "bld-roof",
    paint: {
      "fill-extrusion-pattern": "fac-roof",
      "fill-extrusion-height": ["+", ["*", H, K], 0.05],
      "fill-extrusion-base":   ["max", ["*", MH, K], ["-", ["*", H, K], 0.45]],
      "fill-extrusion-opacity": 1,
    },
  }, before);
}
before should be the ID of the first symbol layer in the style, so the buildings go under the labels. Find it with a loop over map.getStyle().layers.
A pattern can't be rotated or scaled per feature, so windows don't line up with floors exactly. At the camera heights this runs at, nobody can tell.
Step 10: Decide What Falls
Now the simulation part, which is short. For each building, you need the shaking intensity at its location and the probability that a building of that type collapses at that intensity.
Shaking is expressed on the Modified Mercalli scale, I to XII. A standard attenuation relation gives intensity from magnitude M and distance r in kilometres (depth is the hypocentre depth, 10 km for a shallow crustal quake):
const DEPTH_KM = 10;

function mmiAt(M, rKm) {
  const R = Math.sqrt(rKm * rKm + DEPTH_KM * DEPTH_KM);
  const v = 1.5 * M - 3.0 * Math.log10(R) - 0.0018 * R + 1.6;
  return Math.max(0, Math.min(12, v));
}
Collapse probability as a function of intensity is a fragility curve. The published ones are per building class and far more detailed than a simulation needs. This piecewise-linear version is tuned to look right and to give sane casualty numbers. Multiply it by a factor for construction quality and another for height. Mid-rise buildings fare worst, very tall ones are engineered and fare better:
const FRAG = [[6.5, 0], [7, 0.004], [8, 0.025], [9, 0.08], [10, 0.2], [11, 0.38], [12, 0.55]];
const QUALITY = { strict: 0.2, avg: 1, poor: 3 };

function collapseProbability(mmi) {
  if (mmi <= FRAG[0][0]) return 0;
  for (let i = 1; i < FRAG.length; i++) {
    if (mmi <= FRAG[i][0]) {
      const [m0, p0] = FRAG[i - 1], [m1, p1] = FRAG[i];
      return p0 + (p1 - p0) * (mmi - m0) / (m1 - m0);
    }
  }
  return FRAG[FRAG.length - 1][1];
}

function assignDamage(buildings, M, epicentre, quality) {
  const kx = 111320 * Math.cos(epicentre.lat * Math.PI / 180), ky = 110574;
  const q = QUALITY[quality] || 1;

  for (const b of buildings) {
    const rKm = Math.hypot((b.lng - epicentre.lng) * kx, (b.lat - epicentre.lat) * ky) / 1000;
    const mmi = mmiAt(M, rKm);
    const hf = b.h < 5 ? 0.7 : b.h < 35 ? 1.15 : b.h < 70 ? 0.8 : 0.45;
    const pCollapse = Math.min(0.9, collapseProbability(mmi) * q * hf);
    const pDamage = mmi >= 6 ? Math.min(0.6, pCollapse * 2.5 + 0.004) : 0;

    const r = Math.random();
    b.cat = r < pCollapse ? 2 : r < pCollapse + pDamage ? 1 : 0;   // 2 collapse, 1 damaged, 0 fine
    b.start = 0.8 + Math.random() * 2.8;                            // seconds after the shock
  }
}
The per-building randomness is what sells it. Two identical towers next to each other, one falls and one stands. That's also how real earthquakes look.
Step 11: Animate Collapse Without Rebuilding Layers
Here's the mechanism from Step 9 paying off. Each frame, for every building that's falling, set its feature-state k to a number between 1 and its final rubble height. The extrusion shrinks. No layer is rebuilt, no GeoJSON is re-set, and no tiles are re-parsed.
map.setFeatureState({ source: "bld", id: b.id }, { k: 0.62 });
There's one catch, and it's the one that cost me the most time in this whole project: setFeatureState needs a feature ID, and Mapbox Streets buildings don't have one. Calling it against the vector source silently does nothing.
The fix is to copy the buildings you collected into your own GeoJSON source, with an id you control, and tell the source to promote that property to the feature ID:
const feats = buildings.map((b, i) => {
  b.id = i;
  return { type: "Feature", properties: { i, height: b.h, min_height: b.mh }, geometry: b.geometry };
});

map.addSource("bld", {
  type: "geojson",
  data: { type: "FeatureCollection", features: feats },
  promoteId: "i",
  maxzoom: 16,
});
addBuildingLayers(map, "bld", null, firstSymbolLayer);
Now setFeatureState({ source: "bld", id: 17 }, ...) reaches building 17. Keep the original tile-backed layers around until the GeoJSON source reports isSourceLoaded, then remove them, so there's no frame where the city blinks.
The shape of k over time is what makes a collapse look like a collapse rather than a building sliding into the ground. I ended up with five modes, chosen at random per building and constrained by height:
// k0 = starting height multiplier (1), kf = final rubble height, u = progress 0..1
function collapseK(b, u) {
  const k0 = b.k0, sp = k0 - b.kf;
  switch (b.mode) {
    case 1: {   // floor by floor: ns steps, each with a fast drop then a pause
      const s = u * b.ns, i = Math.min(b.ns - 1, Math.floor(s));
      let f = s - i;
      f = f < 0.45 ? f * f / 0.45 * 1.1 : 0.55 + (f - 0.45) * 0.45 / 0.55;
      return k0 - sp * Math.min(1, (i + Math.min(1, f)) / b.ns);
    }
    case 2: {   // soft storey: ground floor gives, building drops one floor, pauses, then goes
      const sd = Math.min(sp * 0.5, 3.2 / b.h);
      if (u < 0.12) return k0 - sd * (u / 0.12) ** 2;
      if (u < 0.5)  return k0 - sd;
      const v = (u - 0.5) / 0.5;
      return k0 - sd - (sp - sd) * v * v;
    }
    case 3: {   // crushed top: upper part fails first
      const pt = sp * 0.45;
      if (u < 0.3)  return k0 - pt * (u / 0.3) ** 2;
      if (u < 0.55) return k0 - pt;
      const v = (u - 0.55) / 0.45;
      return k0 - pt - (sp - pt) * v * v;
    }
    case 4:     // sideways: steady, slightly accelerating
      return k0 - sp * Math.pow(u, 1.6);
    default:    // pancake: accelerating free fall
      return k0 - sp * u * u;
  }
}
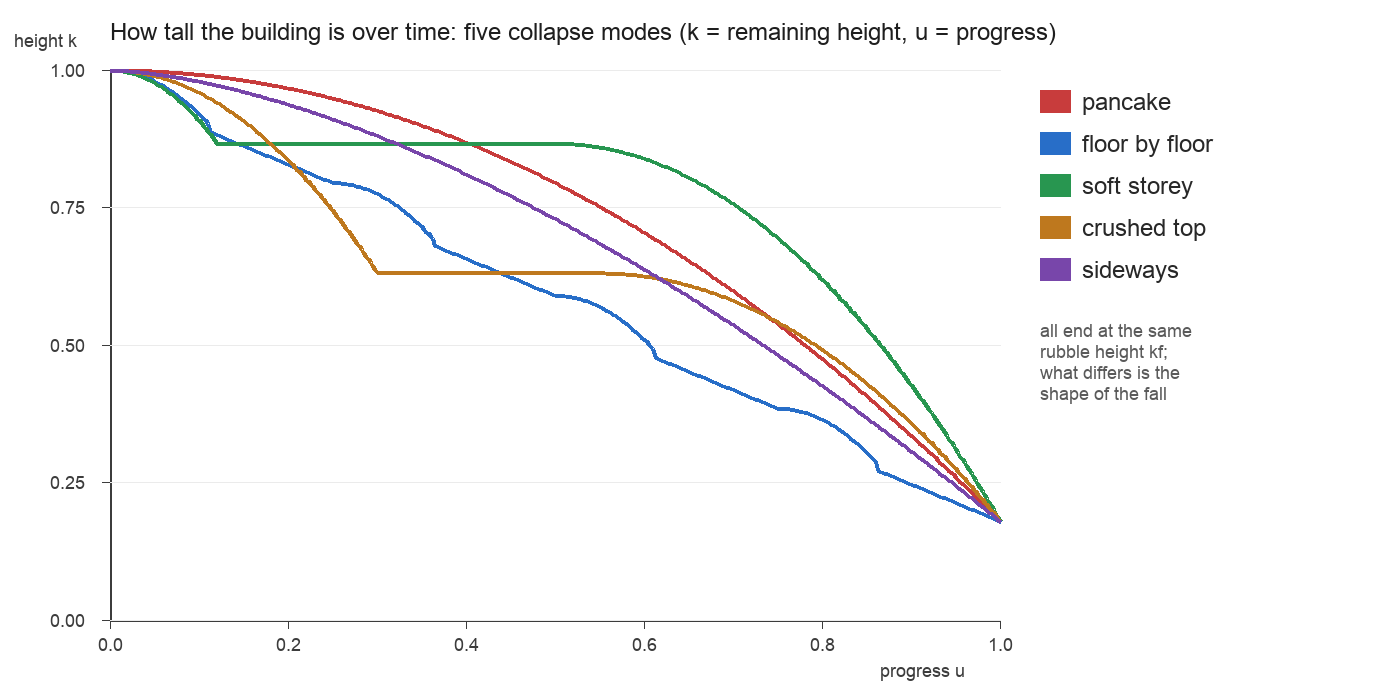
The frame loop is then a few lines per building:
function frame(now) {
  const el = (now - T0) / 1000, dt = Math.min(0.04, (now - last) / 1000);
  last = now;

  for (const b of active) {
    if (b.done || el < b.start) continue;
    const u = Math.min(1, (el - b.start) / b.dur);
    const k = collapseK(b, u);
    map.setFeatureState({ source: "bld", id: b.id }, { k });
    if (u >= 1) { b.done = true; onLanded(b); }
  }
  requestAnimationFrame(frame);
}
For a damaged-but-standing building (cat === 1), kf is close to 1 and the mode is a short settle: the building visibly drops half a metre and stops. It's a small detail, and it's the one that makes the whole street look hit rather than just the buildings that fell.
Clamp dt to 40 ms. If the tab stutters and a frame takes a quarter of a second, a building that was mid-fall would jump instead of fall, and the eye catches that instantly.
Step 12: A Three.js Scene Inside the Map
Shrinking extrusions handle the buildings in the distance. For the ones near the camera, you want to see the structure break: a tower tipping over and snapping into blocks, debris arcing out from the base, or rubble left on the street. That needs objects, so this is where three.js comes in.
The custom layer gets two callbacks: onAdd once, with the map and its GL context, and render every frame, with the context and the map's projection matrix. The non-obvious part is coordinates. You want to work in metres from an origin, not in Mercator units, so build a matrix that converts, and multiply it into the map's projection each frame:
function makeScene(map, origin, before) {
  const mc = mapboxgl.MercatorCoordinate.fromLngLat([origin.lng, origin.lat], 0);
  const s = mc.meterInMercatorCoordinateUnits();
  // metres east / north / up at the origin  ->  Mercator.  Mercator y grows southward, hence -s.
  const toMercator = new THREE.Matrix4()
    .makeTranslation(mc.x, mc.y, mc.z)
    .scale(new THREE.Vector3(s, -s, s));

  const scene = new THREE.Scene();
  const camera = new THREE.Camera();
  scene.add(new THREE.HemisphereLight(0xfff4e4, 0x3c342d, 0.55));
  scene.add(new THREE.AmbientLight(0xffffff, 0.1));
  const sun = new THREE.DirectionalLight(0xfff8ee, 0.8);
  sun.position.set(-0.45, -0.6, 1);
  scene.add(sun);

  let renderer = null;
  const layer = {
    id: "debris3d",
    type: "custom",
    renderingMode: "3d",
    onAdd(m, gl) {
      renderer = new THREE.WebGLRenderer({ canvas: m.getCanvas(), context: gl, antialias: true });
      renderer.autoClear = false;             // the map has already drawn this frame
      renderer.localClippingEnabled = true;   // used to sink buildings below ground
    },
    render(gl, matrix) {
      camera.projectionMatrix.fromArray(matrix).multiply(toMercator);
      renderer.resetState();                  // Mapbox changed GL state since our last draw
      renderer.render(scene, camera);
    },
  };
  map.addLayer(layer, before);
  return { scene, camera, layer };
}
On MapLibre, the second argument of render is an object, and the matrix is at args.defaultProjectionData.mainMatrix. Everything else is the same.
renderingMode: "3d" is what makes the map share its depth buffer with you. A block of concrete that lands behind a standing extrusion is hidden by it, which is the entire reason to render into the map's context rather than in a separate canvas on top.
Thousands of debris pieces means instancing. HazardSim keeps a pool of InstancedMesh objects, one per kind of piece (slabs, wall fragments, rebar, rocks, roof prisms), each with a fixed capacity, and hands out instance indices as pieces are created:
function makePool(scene, geometry, material, capacity) {
  const mesh = new THREE.InstancedMesh(geometry, material, capacity);
  // allocate the colour buffer for the full capacity up front (see Gotchas)
  mesh.instanceColor = new THREE.InstancedBufferAttribute(new Float32Array(capacity * 3).fill(1), 3);
  mesh.count = 0;
  mesh.frustumCulled = false;                 // the map camera is not a three.js camera
  mesh.instanceMatrix.setUsage(THREE.DynamicDrawUsage);
  scene.add(mesh);

  const dummy = new THREE.Object3D(), color = new THREE.Color();
  dummy.rotation.order = "ZXY";
  return {
    n: 0, capacity,
    add(p) {
      if (this.n >= capacity) return -1;
      const i = this.n++;
      this.set(i, p);
      color.setRGB(p.rgb[0], p.rgb[1], p.rgb[2]);
      mesh.setColorAt(i, color);
      mesh.instanceColor.needsUpdate = true;
      mesh.count = this.n;
      return i;
    },
    set(i, p) {
      dummy.position.set(p.x, p.y, p.z);
      dummy.rotation.set(p.tx, p.ty, p.yaw);
      dummy.scale.set(p.sx, p.sy, p.sz);
      dummy.updateMatrix();
      mesh.setMatrixAt(i, dummy.matrix);
      mesh.instanceMatrix.needsUpdate = true;
    },
  };
}

const concrete = new THREE.MeshStandardMaterial({ map: concreteTexture, roughness: 1 });
const pools = {
  slab: makePool(scene, new THREE.BoxGeometry(1, 1, 1), concrete, 30000),
  wall: makePool(scene, new THREE.BoxGeometry(1, 1, 1), facadeMaterial, 1500),
  bar:  makePool(scene, new THREE.BoxGeometry(1, 1, 1), new THREE.MeshStandardMaterial({ color: 0x6e4c38, metalness: 0.25 }), 20000),
  rock: makePool(scene, rockGeometry(), concrete, 9000),
};
Thirty thousand slabs sounds like a lot, but it's one draw call.
One more thing the map needs from you: it only redraws when something changes. Your scene changing is not, from the map's point of view, something changing. Call map.triggerRepaint() at the end of every frame in which you moved anything, or your meshes will update in memory and never on screen.
Step 13: From Footprint to a Box That Tips Over
The vector tile gives you a footprint polygon. To tip a building over, you need a box: a centre, an orientation, and two side lengths. The oriented bounding box is a few lines:
function orientedBox(ring, kx, ky, origin) {
  // ring in lng/lat -> local metres
  const loc = ring.map(([lng, lat]) => [(lng - origin.lng) * kx, (lat - origin.lat) * ky]);

  // the longest edge sets the orientation
  let ang = 0, best = 0;
  for (let i = 1; i < loc.length; i++) {
    const ex = loc[i][0] - loc[i - 1][0], ey = loc[i][1] - loc[i - 1][1];
    if (ex * ex + ey * ey > best) { best = ex * ex + ey * ey; ang = Math.atan2(ey, ex); }
  }

  // project every vertex onto that axis and its normal, take the extents
  const ca = Math.cos(ang), sa = Math.sin(ang);
  let u0 = Infinity, u1 = -Infinity, v0 = Infinity, v1 = -Infinity;
  for (const [x, y] of loc) {
    const u = x * ca + y * sa, v = -x * sa + y * ca;
    if (u < u0) u0 = u; if (u > u1) u1 = u;
    if (v < v0) v0 = v; if (v > v1) v1 = v;
  }
  const cu = (u0 + u1) / 2, cv = (v0 + v1) / 2;
  return {
    x: cu * ca - cv * sa, y: cu * sa + cv * ca,    // centre, metres from origin
    ang,
    L1: Math.max(2, u1 - u0), L2: Math.max(2, v1 - v0),
  };
}
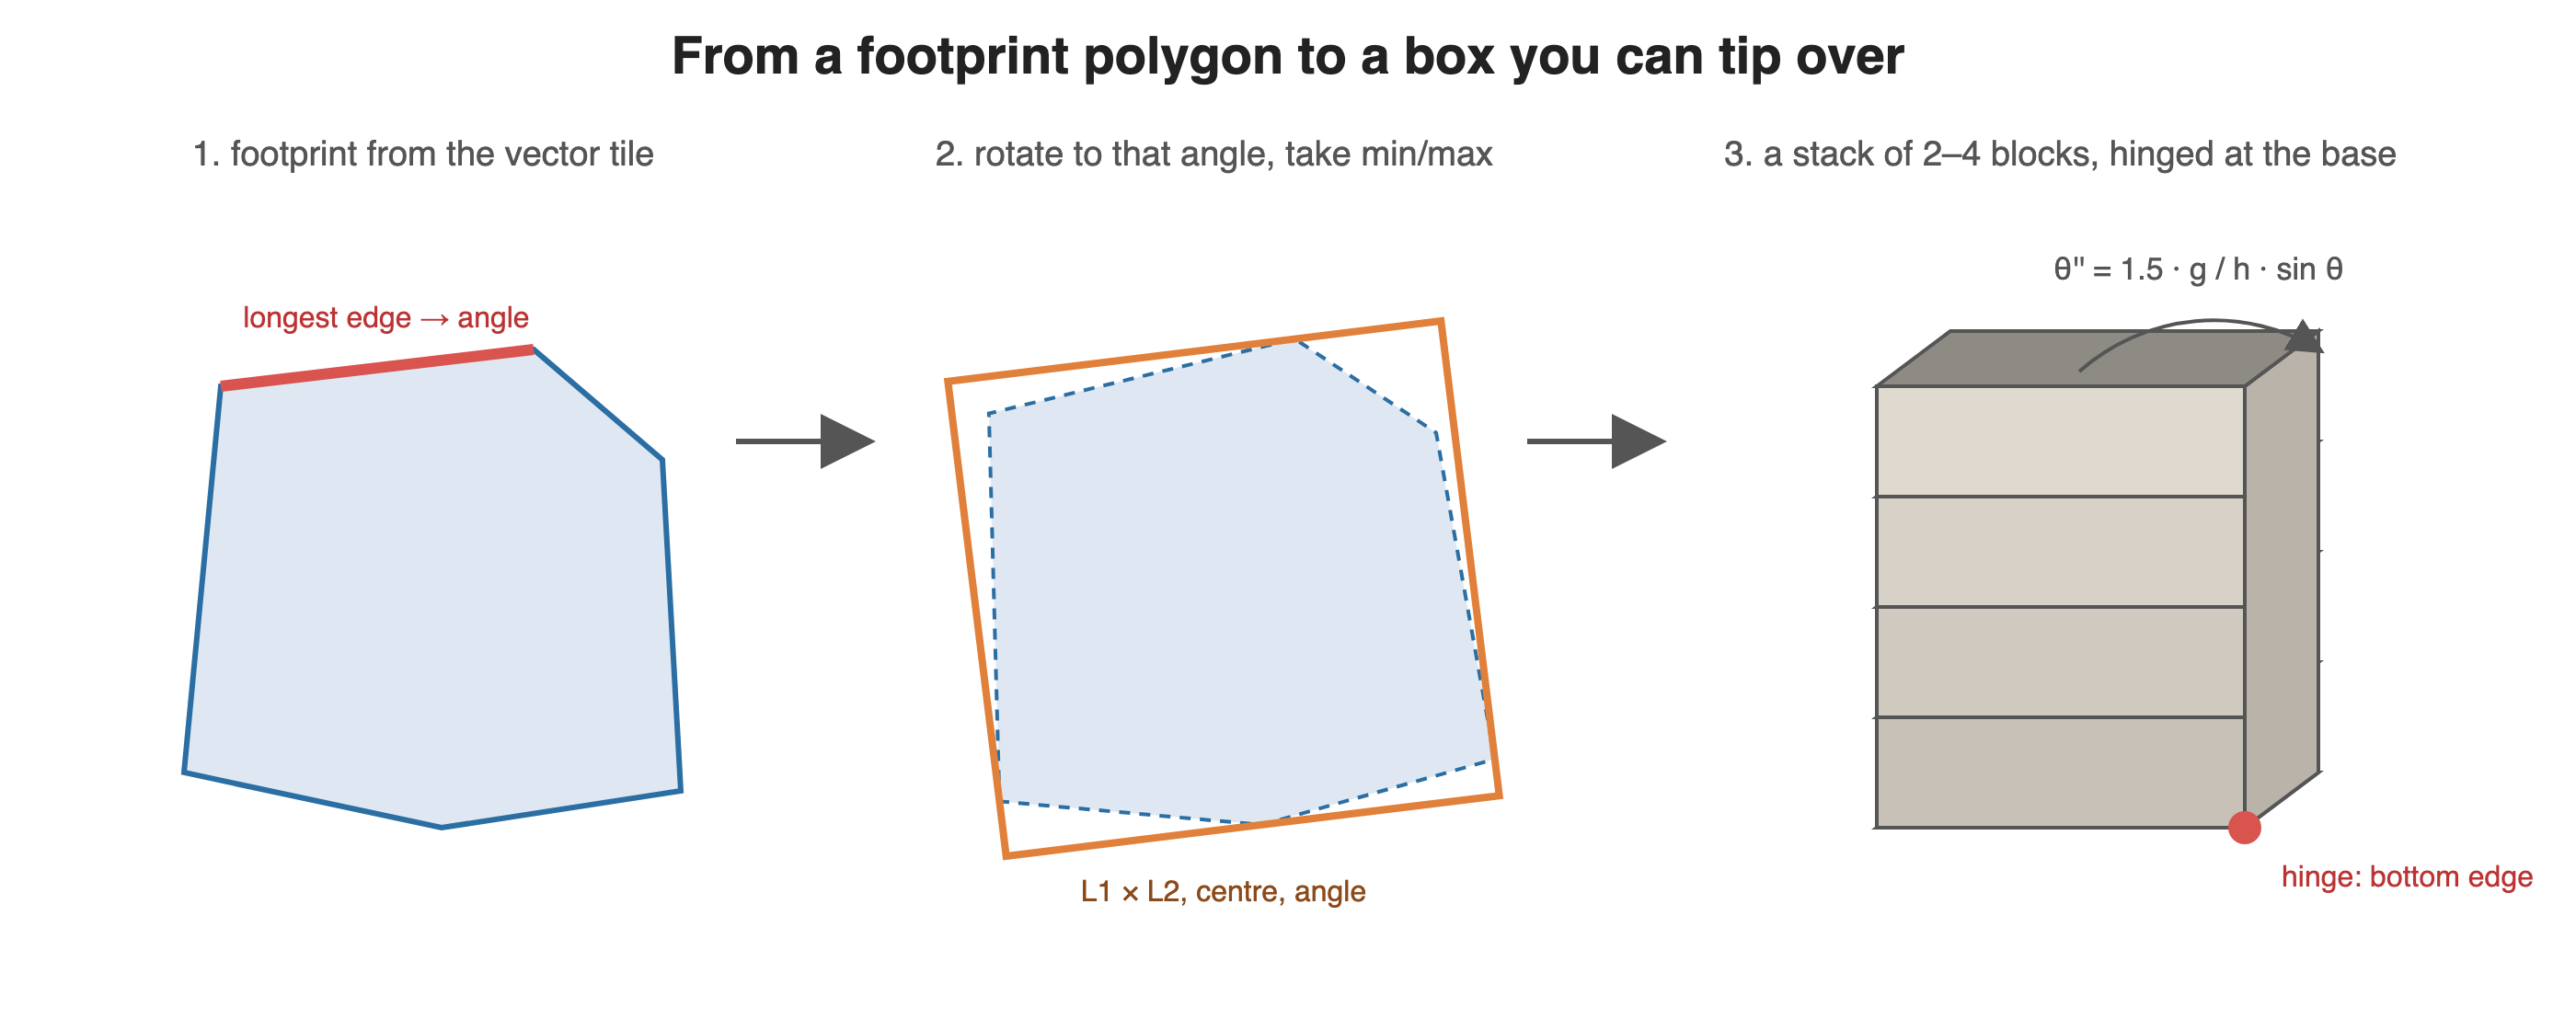
The box becomes a stack of two to four blocks, one Mesh each, in a Group whose origin is on the bottom edge the building will rotate around. The physics is a rigid body falling over: angular acceleration proportional to g / h · sin θ, with a small initial nudge so it starts moving. When the lean passes a threshold, the upper blocks detach and fly ballistically with the velocity they had at that instant:
function startTip(scene, box, h, onLand) {
  const n = Math.max(2, Math.min(4, Math.round(h / 9))), hs = h / n;
  const geo = new THREE.BoxGeometry(box.L1, box.L2, hs);
  const group = new THREE.Group();
  group.position.set(box.x + Math.cos(box.ang) * box.L1 / 2, box.y + Math.sin(box.ang) * box.L1 / 2, 0);
  group.rotation.z = box.ang;
  scene.add(group);

  const segs = [];
  for (let i = 0; i < n; i++) {
    const m = new THREE.Mesh(geo, wallMaterial);
    m.frustumCulled = false;
    group.add(m);
    segs.push({ m, free: false, gone: false, x: -box.L1 / 2, z: hs * (i + 0.5), th: 0, px: 0, pz: 0 });
  }

  const tip = { th: 0.03, w: 0.22, broke: false, bend: 0.1 + Math.random() * 0.14, brk: 0.4 + Math.random() * 0.3 };

  function pose() {
    let bx = -box.L1 / 2, bz = 0;
    for (let j = 0; j < n; j++) {
      const s = segs[j];
      if (s.free) continue;
      const th = tip.th * (1 + tip.bend * j);        // upper blocks bend a little further
      const sn = Math.sin(th), cs = Math.cos(th);
      if (j === 0) { bx = -box.L1 / 2 * cs; bz = box.L1 / 2 * sn; }
      s.px = s.x; s.pz = s.z;
      s.x = bx + sn * hs / 2; s.z = bz + cs * hs / 2; s.th = th;
      bx += sn * hs; bz += cs * hs;
      s.m.position.set(s.x, 0, s.z);
      s.m.rotation.y = th;
    }
  }

  return function tick(dt) {
    tip.w = Math.min(2.2, tip.w + 1.5 * 9.8 / h * Math.sin(tip.th) * dt);
    tip.th += Math.min(0.09, tip.w * dt);          // never more than ~5 degrees per frame
    pose();

    if (!tip.broke && tip.th * (1 + tip.bend * (n - 1)) > tip.brk && n > 1) {
      tip.broke = true;
      for (let j = 1; j < n; j++) {
        const s = segs[j];
        s.free = true;
        s.vx = Math.max(-18, Math.min(18, (s.x - s.px) / Math.max(dt, 0.008)));
        s.vz = Math.max(-18, Math.min(18, (s.z - s.pz) / Math.max(dt, 0.008)));
        s.w = tip.w * (1 + tip.bend * j) * (1.05 + Math.random() * 0.25);
      }
    }

    let left = 0;
    for (const s of segs) {
      if (s.gone) continue;
      if (s.free) {
        s.vz -= 9.8 * dt; s.x += s.vx * dt; s.z += s.vz * dt; s.th += s.w * dt;
        s.m.position.set(s.x, 0, s.z);
        s.m.rotation.y = s.th;
      }
      const landed = s.free ? s.z < Math.min(hs, box.L1) * 0.5 + 0.3 : tip.th >= 1.25;
      if (landed) {
        s.gone = true;
        group.remove(s.m);
        onLand(group.position.x + Math.cos(box.ang) * s.x, group.position.y + Math.sin(box.ang) * s.x);
      } else left++;
    }
    if (!left) { scene.remove(group); geo.dispose(); return true; }   // finished
    return false;
  };
}
The clamps aren't decoration. Velocity at detachment is limited to 18 m/s and the frame step dt to a minimum of 8 ms, because the velocity is computed from a position difference, and a hiccup frame would otherwise launch a block into orbit. Angular velocity is limited to 2.5 rad/s and the lean to 0.09 rad per frame for the same reason. Every one of those numbers was added after watching a building do something a building can't do.
onLand is where a collapse starts to look like one: each block that hits the ground spawns a burst of debris and dust at that point, and leaves a pile.
Step 14: Debris and Dust
Debris is the instanced pools from Step 12 plus gravity. When a collapsing building passes a milestone (the first drop, each floor in floor-by-floor mode, a block landing), throw a handful of pieces out from the edges of the footprint, with velocity pointing away from the centre:
function throwDebris(pools, b, origin, kx, ky, top, n) {
  const ring = b.polys[0][0];
  const cx = (b.lng - origin.lng) * kx, cy = (b.lat - origin.lat) * ky;
  for (let i = 0; i < n; i++) {
    // a random point on a random edge of the footprint
    const e = 1 + Math.floor(Math.random() * (ring.length - 1)), t = Math.random();
    const a = ring[e - 1], z = ring[e];
    const x = ((a[0] + (z[0] - a[0]) * t) - origin.lng) * kx;
    const y = ((a[1] + (z[1] - a[1]) * t) - origin.lat) * ky;
    // outward, with a little spread
    const ox = x - cx, oy = y - cy, ol = Math.hypot(ox, oy) || 1, v = 2 + Math.random() * 6;
    const size = 0.3 + Math.random() * 1.1;
    const idx = pools.rock.add({
      x, y, z: top * (0.35 + Math.random() * 0.65),
      yaw: Math.random() * 6, tx: Math.random() * 6, ty: Math.random() * 6,
      sx: size, sy: size * 0.8, sz: size * 0.6, rgb: concreteColour(),
    });
    if (idx >= 0) flying.push({ idx, x, y, z: top, vx: ox / ol * v, vy: oy / ol * v, vz: Math.random() * 3, spin: (Math.random() - 0.5) * 8 });
  }
}

function tickDebris(pools, dt) {
  for (let i = flying.length - 1; i >= 0; i--) {
    const p = flying[i];
    p.vz -= 9.8 * dt;
    p.x += p.vx * dt; p.y += p.vy * dt; p.z += p.vz * dt;
    p.tx += p.spin * dt;
    if (p.z <= p.sz * 0.35) { p.z = p.sz * 0.35; flying.splice(i, 1); }   // landed: stays as rubble
    pools.rock.set(p.idx, p);
  }
}
Pieces that land simply stop being updated and stay in the pool. That's your rubble, for free.
HazardSim adds a few more things on top: stacked floor slabs on a 9-metre grid where a building stood, wall fragments with windows, bent rebar, a low fill-extrusion mound under the pile so the ground isn't flat, and for the closest buildings, a set of photogrammetry-scanned rubble models. Those are polish, and the pool plus gravity gets you most of the way.
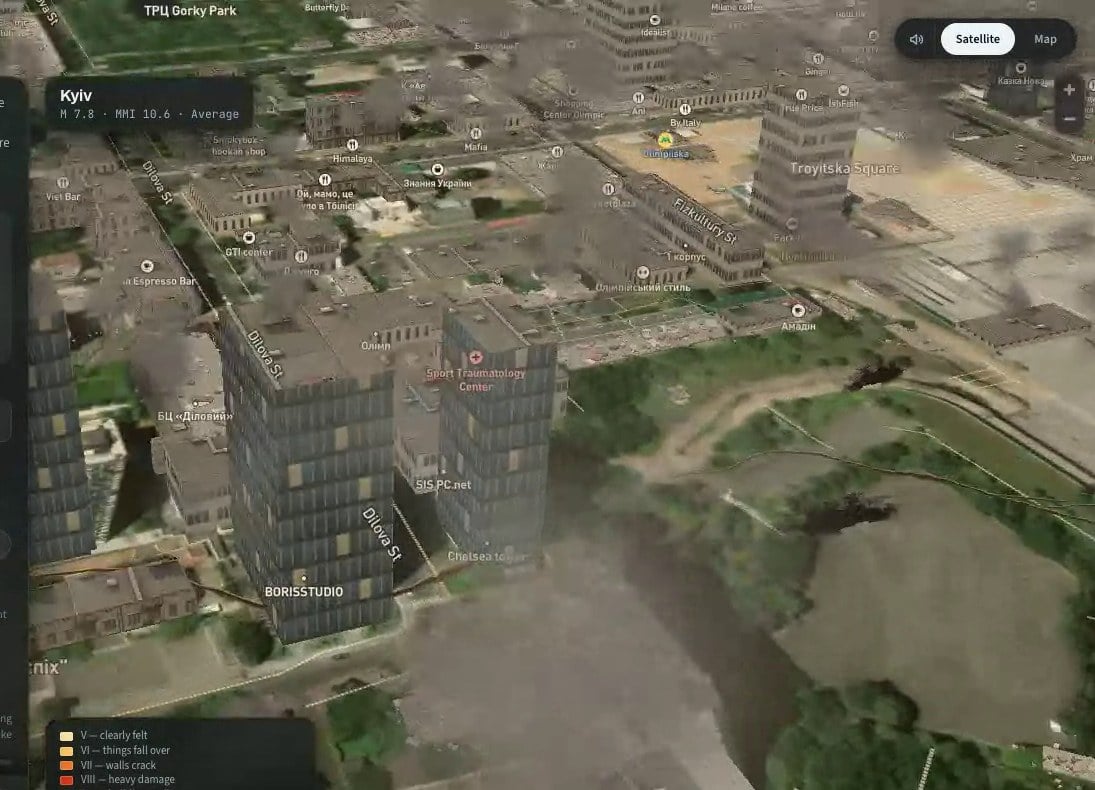
Dust is the one place where I draw in screen space, and it's worth saying why that's fine here when it was fatal for water in Part 1. Dust particles are small, there are hundreds of them, and each lives three to eight seconds. They're also drawn as soft sprites with per-particle position, size, and rotation projected from a map point each frame. There are no edges to see and nothing to line up with. The screen-space rule is about large, persistent things with shape.
The important decision is where dust comes from. Early versions had a constant haze over the city and burning fires, and it looked like a screensaver. What reads as real is dust that comes only from events: a puff when a floor drops, a surge along the ground when a building lands, a jet from the ground floor of a soft-storey collapse. Each event emits a burst with a size proportional to the building's footprint and a vertical speed proportional to the drop, then nothing until the next event.
function emitDust(b, level, n, surge) {
  for (let i = 0; i < n && dust.length < MAX_DUST; i++) {
    const a = Math.random() * Math.PI * 2;
    const speed = surge ? 5 + Math.random() * 8 : 1 + Math.random() * 3;
    dust.push({
      lng: b.lng, lat: b.lat,                                        // anchor on the map
      x: Math.cos(a) * b.rf * 0.6, y: Math.sin(a) * b.rf * 0.6,     // offset, metres
      z: surge ? Math.random() * 5 : level * (0.2 + Math.random() * 0.8),
      vx: Math.cos(a) * speed, vy: Math.sin(a) * speed,
      vz: surge ? 0.3 + Math.random() * 1.2 : 1.5 + Math.random() * 3,
      size: (surge ? b.rf * 0.5 + 6 : b.rf * 0.6 + 4) * (0.7 + Math.random() * 0.6),
      grow: 3 + Math.random() * 5,
      t: 0, life: (surge ? 5 : 3.5) + Math.random() * 2.5,
      sprite: sprites[Math.floor(Math.random() * sprites.length)],
      alpha: 0.5 + Math.random() * 0.3,
    });
  }
}
Per frame, each particle decelerates, drifts with the wind, grows, and is projected: map.project([lng + x / kx, lat + y / ky]) gives the screen position of its ground point, and the height is applied as y -= z * pixelsPerMetre * sin(pitch). Sort by screen depth, draw back to front with drawImage, and fade with age. It's a few hundred drawImage calls per frame on a 2D canvas over the map, and it costs almost nothing.
Step 15: The Camera Has to Shake
Everything so far could be running silently in a corner of the screen. What makes a viewer feel the earthquake is the camera.
Two things. First, the dive: from the overview, ease to zoom 14.6 at 45 degrees, hold until tiles are loaded, then ease to zoom 16.2 at 62 degrees over the epicentre. The hold isn't optional. If you dive straight to zoom 16, the vector tiles for that zoom haven't arrived, querySourceFeatures returns almost nothing, and the earthquake hits an empty city.
function diveToCity(map, center, then) {
  const bearing = map.getBearing();
  map.easeTo({ center, zoom: 14.6, pitch: 45, bearing: bearing - 10, duration: 1100, essential: true });
  const t1 = Date.now();
  (function hold() {
    const loaded = !map.isMoving() && map.areTilesLoaded();
    if (Date.now() - t1 > 1000 && (loaded || Date.now() - t1 > 2000)) {
      map.easeTo({ center, zoom: 16.2, pitch: 62, bearing: bearing - 25, duration: 1500, essential: true });
      map.once("moveend", then);
    } else setTimeout(hold, 150);
  })();
}
Second, the shake. Don't move the map camera for this. A camera that jitters through easeTo fights the animation system and loads tiles for every jitter. Shake the container with a CSS transform. The map doesn't know it moved:
function shake(durationMs, magnitude) {
  const el = map.getContainer();
  const w = window.innerWidth, h = window.innerHeight;
  const amp = Math.min(28, w * 0.02, Math.max(6, (magnitude - 4) * 4.2));
  const dir = Math.random() * Math.PI;
  const t0 = performance.now();
  let last = t0, phase = 0;

  function tick(now) {
    const k = (now - t0) / durationMs;
    if (k >= 1) { el.style.transform = ""; return; }
    const dt = Math.min(0.05, (now - last) / 1000); last = now;

    // builds up over the first third, then decays; frequency rises with it
    let env, omega;
    if (k < 0.35) { const u = k / 0.35; env = 0.15 + 0.85 * u * u * (3 - 2 * u); omega = 7 + 39 * u * u; }
    else          { const v = (k - 0.35) / 0.65; env = Math.pow(1 - v, 1.4); omega = 46 - 18 * v; }
    phase += omega * dt;

    const a = amp * env;
    const osc = Math.sin(phase) * 0.78 + (Math.random() - 0.5) * 0.44 * Math.min(1, omega / 30);
    const x = Math.cos(dir) * osc * a, y = Math.sin(dir) * osc * a * 0.7;
    el.style.transform = `translate(${x.toFixed(1)}px, ${y.toFixed(1)}px) rotate(${(osc * a * 0.012).toFixed(3)}deg) scale(${(1 + 2.4 * amp / Math.min(w, h) * env).toFixed(4)})`;
    requestAnimationFrame(tick);
  }
  requestAnimationFrame(tick);
}
The envelope matters more than the amplitude. Real shaking builds for a second or two, peaks, and dies off over several more, with the frequency rising as it builds. A constant jitter reads as a broken video. An aftershock at about half the amplitude, three or four seconds after the main shock, finishes the effect.
When the shaking stops, ease the camera down to the centre of the nearest collapses and hold for a few seconds so the rubble gets its moment, then pull back up to the intensity rings and the casualty figures.
Keeping It Fast
A few decisions kept this at 60 fps on a laptop and usable on phones.
1. Pools with Fixed Capacity
Every instanced pool has a cap, and add returns -1 when it's full. The caps scale down for low-power devices: 9,000 slabs instead of 30,000, 3,000 rocks instead of 9,000. The scene degrades to fewer pieces rather than to a slideshow.
2. A Device Tier, Decided Once
Mobile user agent, navigator.deviceMemory < 6, hardwareConcurrency <= 4, or a short screen side under 700 px puts the device in the low tier. The low tier skips the three.js tipping entirely and uses only shrinking extrusions, caps dust at a third, and drops the hero models.
3. Rebuild the Rubble Mound at Most Every 1.2 Seconds
The low fill-extrusion mound under each pile is a GeoJSON source, and setData on a GeoJSON source re-parses it. Doing that once per collapsed building was the main cause of stutter in early versions. Now landed buildings go into a pending list that's flushed on a timer.
4. Never Remove a Collapsed Building from the Source
It stays in bld with k set to 0.001. Removing features means setData, and setData means a stall.
5. Load Assets on Intent
The textures and models for the full-detail mode add up to 24 MB. They start downloading when the visitor clicks the earthquake tab, not on page load, and only in the full tier.
What Went Wrong, and Why
Each of these cost me real time, and the first two are why Part 1 exists at all.
The Sticker Problem
My first version of a "wall of water" was a video clip drawn on a screen-space canvas, positioned by projecting a map point each frame. On a 13-inch laptop it almost worked. On a 4K monitor it was a rectangle with soft edges hovering over the city, obviously not part of the scene.
No amount of tuning opacity, feathering, or size fixes this, because the problem isn't the sprite. A sprite has no place in a 3D world. Everything in Steps 3 to 6 is the alternative.
If you do need screen-space elements, say a splash sprite anchored to a point, keep them small, short-lived, and numerous, and accept that they'll never carry the shot.
I Couldn't Find My Layer, Twice
The 3D water wall from the end of Part 1 rendered without an error, the mesh moved exactly where my debug probe said it should, and nothing appeared on screen. I'd added it with map.addLayer(layer, "flood"), which inserts it below the flood raster, and the opaque water was hiding my wall. Check map.getStyle().layers before you check anything else.
The second time I lost a layer, it was the opposite problem: it wasn't there at all. map.getStyle().layers doesn't list custom layers. Check with map.getLayer("debris3d") instead. I spent a while convinced the layer wasn't being added.
24 Levels of Transparency
I built sprite sheets with soft alpha edges and ran them through PIL.Image.quantize() to shrink the PNG. The palette compression quantized the alpha channel along with the colours. 256 levels became 24, the smooth falloff became a staircase, and every step was a hard straight edge that looked exactly like a tile boundary. I spent two rounds hunting for a tiling bug that didn't exist.
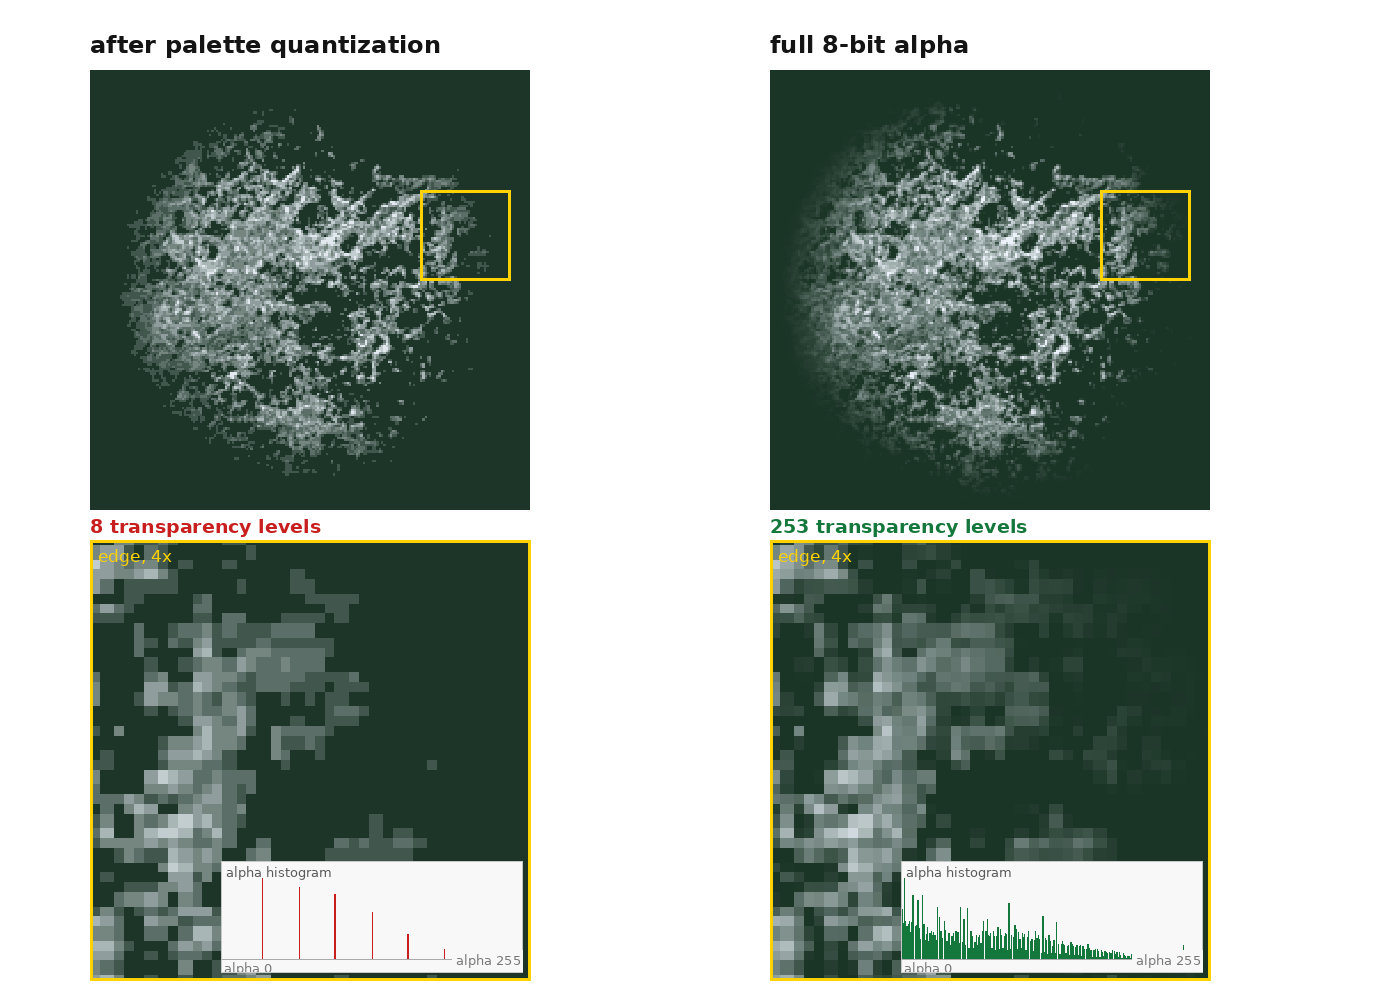
The fix was to stop quantizing and make the RGB channels constant (the sprites were white anyway), so PNG compression had nothing left to do. The file got three times smaller. I now check alpha with a histogram instead of trusting my eyes.
Same Filename, Different File
I re-encoded flood.webm with a different grade and redeployed. Visitors kept getting the old one for hours. The CDN cached by URL, and a ?v=2 query string didn't bust it for a file that already existed.
Renaming the file to flood2.webm fixed it in one deploy. Since then I rename every binary asset I update instead of versioning the URL.
Headless Screenshots Lied, Twice
I tested under headless Chrome with a software GL renderer. Each screenshot took a second or two to capture, so a "sequence" of frames was nothing of the sort, and I spent an afternoon tuning timings against noise.
Two things fixed it: record the browser session as video and cut frames with ffmpeg, and, for colour, read the simulation canvas directly with getImageData instead of measuring the composited screen. The second one sounds obvious written down, but it took me an afternoon to arrive at it.
The same headless setup fooled me again on the earthquake. Satellite tiles load slowly there, and for a long time I thought my building layer was broken because screenshots showed a black city. It was the base map that hadn't arrived. If a layer looks wrong in headless tests, wait for map.areTilesLoaded() before trusting the screenshot.
Nothing Happened When I Set Feature State
setFeatureState against the tile source did nothing and reported nothing, because the features have no IDs. The fix is the GeoJSON copy with promoteId from Step 11. It took me an embarrassingly long time to find, because the API doesn't fail. It just doesn't do anything.
Every Instance Was Black
InstancedMesh.setColorAt in three r128 lazily creates the colour buffer the first time you call it, sized to the mesh's current count. My pools started with count = 0, so the buffer was created with zero entries, and every piece rendered black. Allocate instanceColor yourself, for the full capacity, before the first setColorAt. That's the line in makePool.
Half the Debris Vanished When I Panned
three.js frustum-culls meshes against its own camera. Our camera is a bare THREE.Camera with a projection matrix stuffed into it each frame and no idea where the map is looking, so its idea of the frustum is nonsense. Set frustumCulled = false on every mesh in the custom layer.
The Scene Updated But the Screen Didn't
The map only repaints when it thinks something changed. Call map.triggerRepaint() after you move your objects. Without it the animation runs at whatever rate the map happens to repaint for other reasons, which in a still scene is zero.
A Sky Made Everything Disappear
On a different project with the same setup, map.setSky(...) hid the whole three.js scene. The sky writes to the depth buffer, and everything the custom layer draws afterwards fails the depth test. If you render 3D into the map, don't enable the sky layer.
The idle Event Never Fired in a Background Tab
I preloaded models on map.on("idle"). In a background tab the map can go a very long time without becoming idle, and visitors who opened the site in a tab and came back later got an earthquake with no models. The preload moved to the moment the hazard type is selected.
Conclusion
The whole guide reduces to two structures.
On the ground:
Align a grid to the map's tile pyramid, so every tiled dataset drops in without resampling.
Decode free elevation tiles into that grid.
Register a canvas as a map source over the grid's rectangle, with
animate: true.Run the simulation on the grid once. Animate by writing pixels every frame.
Use
source-atopanddestination-into drape textures exactly inside the simulated shape.Move the camera. The drawing comes along.
With height:
Pull buildings from the vector tiles the map already loaded. Deduplicate, as they have no IDs.
Draw them all as
fill-extrusionwith a per-feature height multiplier, through a GeoJSON copy withpromoteIdso feature state works.Decide damage from an attenuation relation and a fragility curve, with randomness per building.
Animate collapse by writing the multiplier each frame.
For the buildings near the camera, render
three.jsinto the map's own GL context withrenderingMode: "3d", so the depth buffer is shared.Turn footprints into oriented boxes, tip them over, snap them into blocks, and throw instanced debris. Emit dust only from events. Shake the container, not the camera.
The idea under all of it is the one I kept relearning: anything that belongs to the world has to be drawn in the world's coordinates. A canvas on top of the map is a sheet of glass. A canvas inside the map is the ground, and a three.js scene inside the map's GL context is the air above it.
Every improvement that made either simulation look real came from moving something out of the first category and into the second.
The other thing I'd tell myself at the start: the map engine and three.js are not competitors. The map is better at ten thousand static buildings than anything you'll write, and three.js is better at ten moving ones than any expression language.
Give each the job it's good at, and spend your effort on the seam between them, which is almost entirely the coordinate transform in Step 12 and the feature-state trick in Step 11.
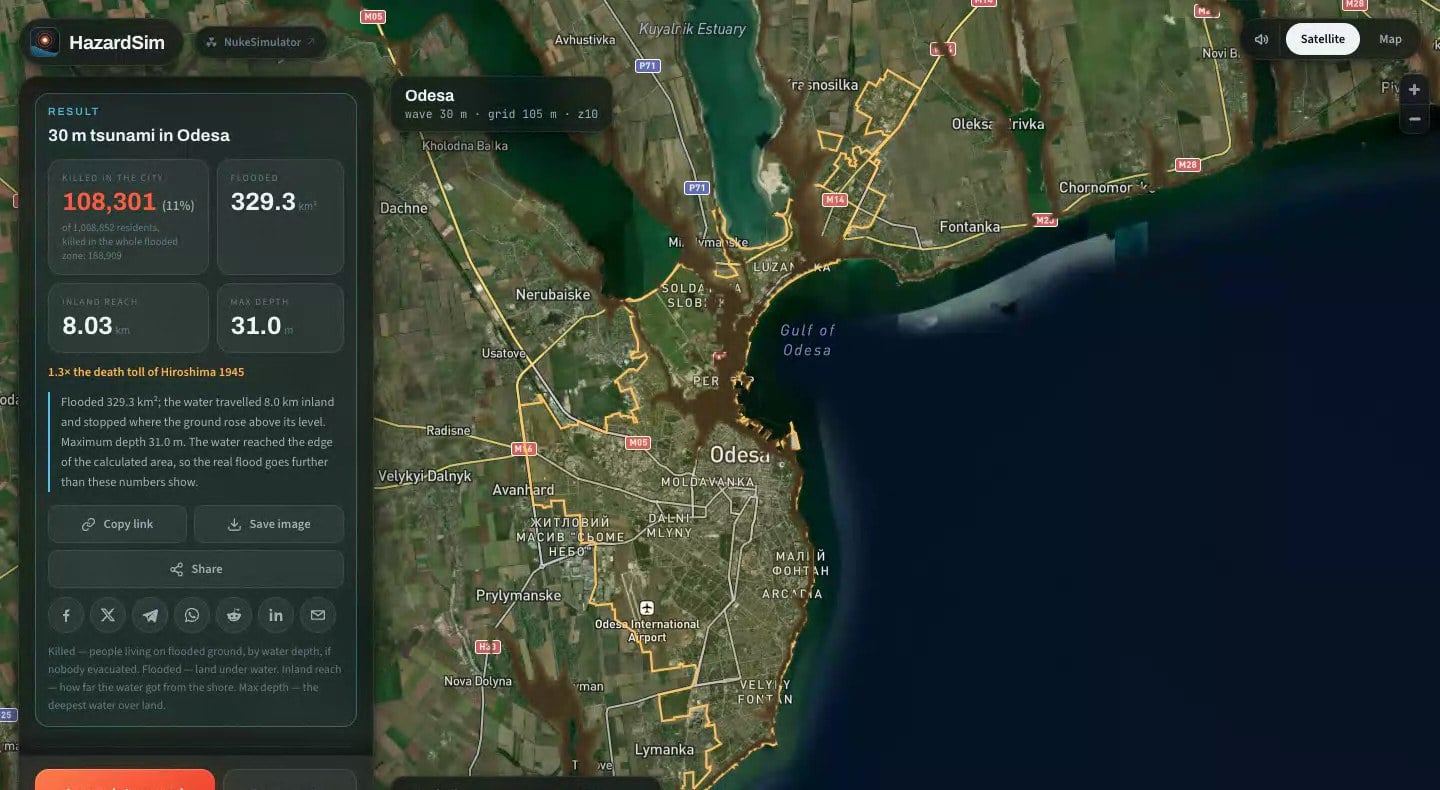
You can see both scenarios at hazardsim.com. Pick a coastal city and launch a tsunami, or pick any city, set a magnitude, and press the button. The code in this guide is a cleaned-up version of what runs there. Thanks to Tim for breaking it in ways I never would have.


