
Building cross-browser web applications can be a difficult task, as many browsers offer few debugging tools that often vary between them. Fortunately, today most browsers support modern standards and provide helpful features for developers.
Major browsers, such as Chrome, Firefox, and Edge, continuously update their developer tools, with each update potentially bringing new features to web developers. These new features increase the ease of use by adding intuitive UIs, more advanced debugging, and enhanced performance analysis tools.
Staying up to date with these changes lets you use your browser DevTools to its fullest potential to make your workflow easier and speed up the delivery of your web applications.
Table of Content
In this article, we’ll discover some good cross-browser DevTools features and discuss how to use them.
Let’s get started!
How to Use Scroll Into View in DevTools
When debugging, there may be a lot of HTML nodes to skim through to find out where your issue is. Most of the time, when you find the node, you won’t see it until you scroll to where it is on the page.
The Scroll Into View feature easily brings the DOM node into the viewport by right-clicking and selecting Scroll Into view in Chrome, Firefox, and Edge.
This feature saves a lot of time when debugging CSS issues or wanting to verify the correct placement of elements on a page, ensuring you can quickly locate elements on the page through the HTML nodes without needing to scroll through many lines of content manually.
In the image below, we are trying to find a h2 element that is nested inside several layers of other elements.
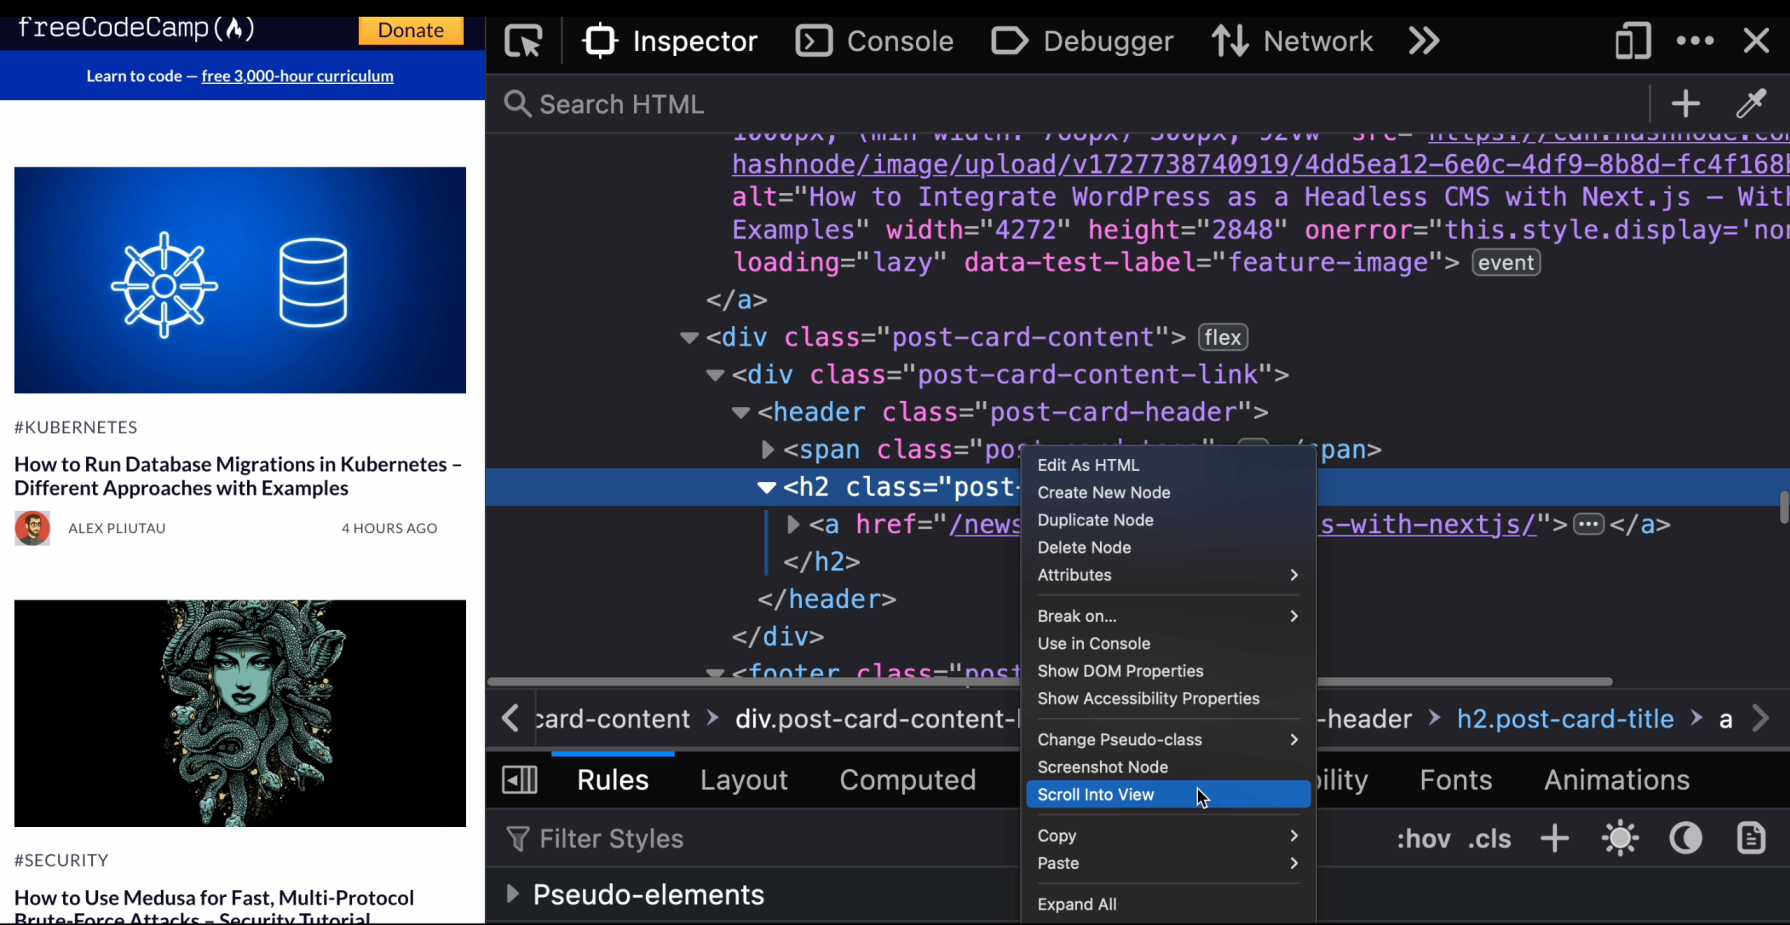
In the image above, instead of scrolling through the entire page to spot the h2 element, we right-clicked and used the Scroll Into View feature to instantly bring the h2 element into view. We can expand on this feature to do other things with the element when we have scrolled to it. We can tweak the CSS properties in real time via the styles panel and even find and fix layout issues.
How to Use Console Shortcuts in DevTools
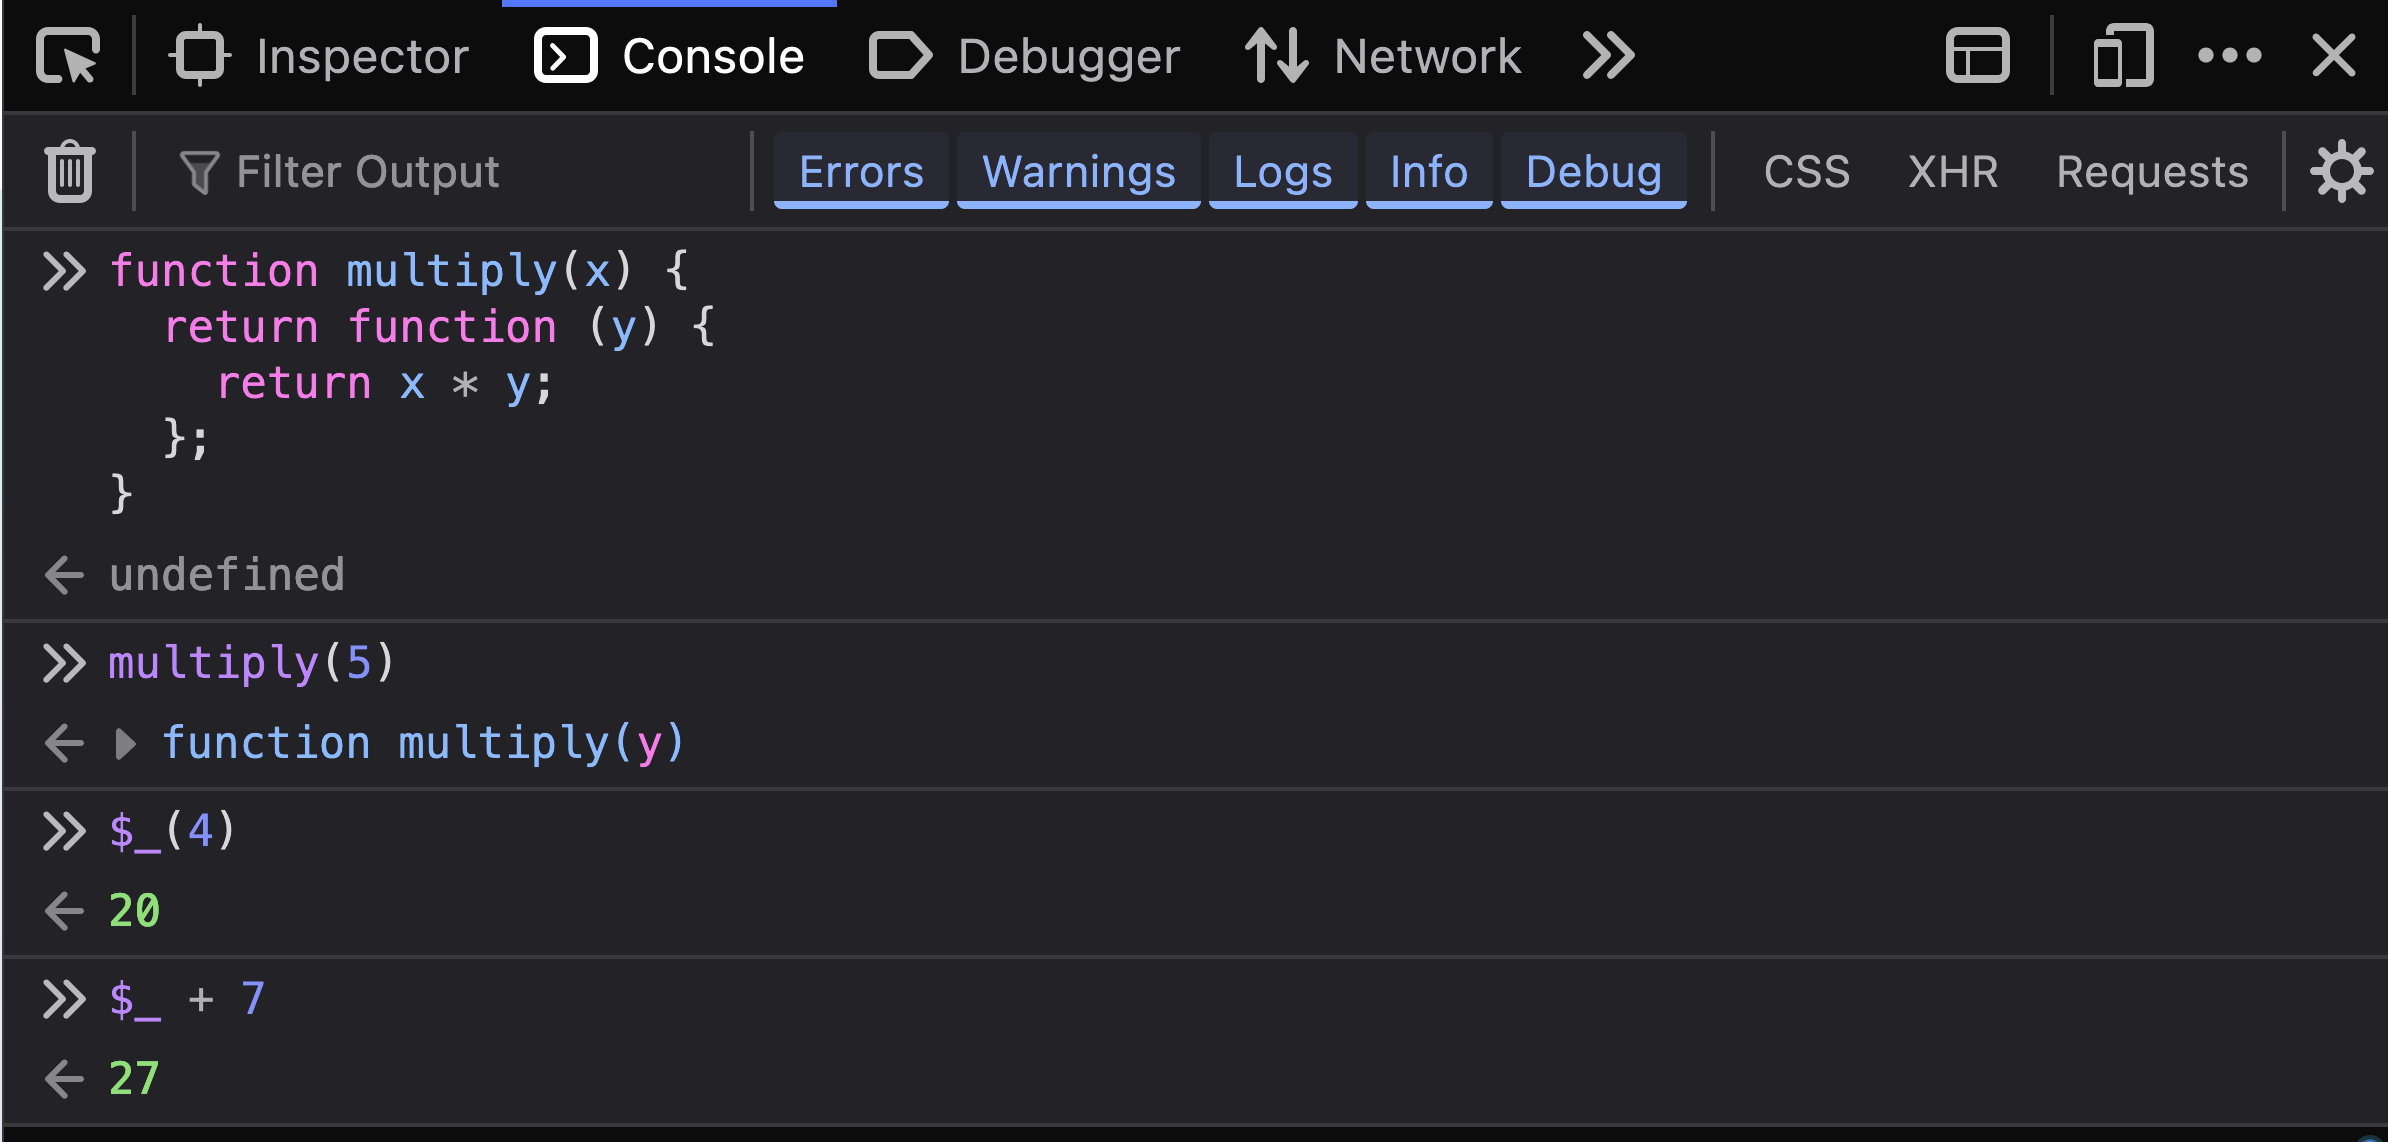
There are lots of shortcuts that can be used in the Console that allows you, as the developer, to debug faster. One of them is the $_ shortcut. This shortcut returns the value of the most recent expression evaluated by the Console. Let’s say, for example, we have a multiplier function:
In the image below, you can see how the $_ shortcut is used as a special variable in the browser Console to store the most recently evaluated expression:
Without the $_ shortcut, you would have to either retype the entire function call or you might store the result in a variable like this:
let result = multiply(5)
result(4) // returns 20
In the code above, the multiply(5) function has to return a function and assign the function to result, which is then called with 4 as the parameter result(4).
I'm sure you can see how this already introduces some redundancy and extra steps that can be cumbersome when you're dealing with more complex operations or when doing multiple steps of calculations. This is where the $_ shortcut shines. When we run the multiply(5) code in the Console, a function is returned and stored in the $_ variable by the Console, which we can access using the $_ shortcut.
Another shortcut is using $0 to access nodes from the Console. $0 can be used to access the currently selected node in the DOM tree from within the Console. As you inspect a webpage with DevTools, you often browse the DOM tree in the Elements panel to find the element that you're interested in. Once you click on an element in this panel, DevTools internally keeps track of this element, and it becomes the currently selected element.
The $0 is a shortcut that refers to the currently selected element in the Console, so you can manipulate it directly in the Console without writing a query to select it again.
The screenshot below shows how we can use $0 in the Console to access the selected node in the DOM tree and change the background color to whatever we want.
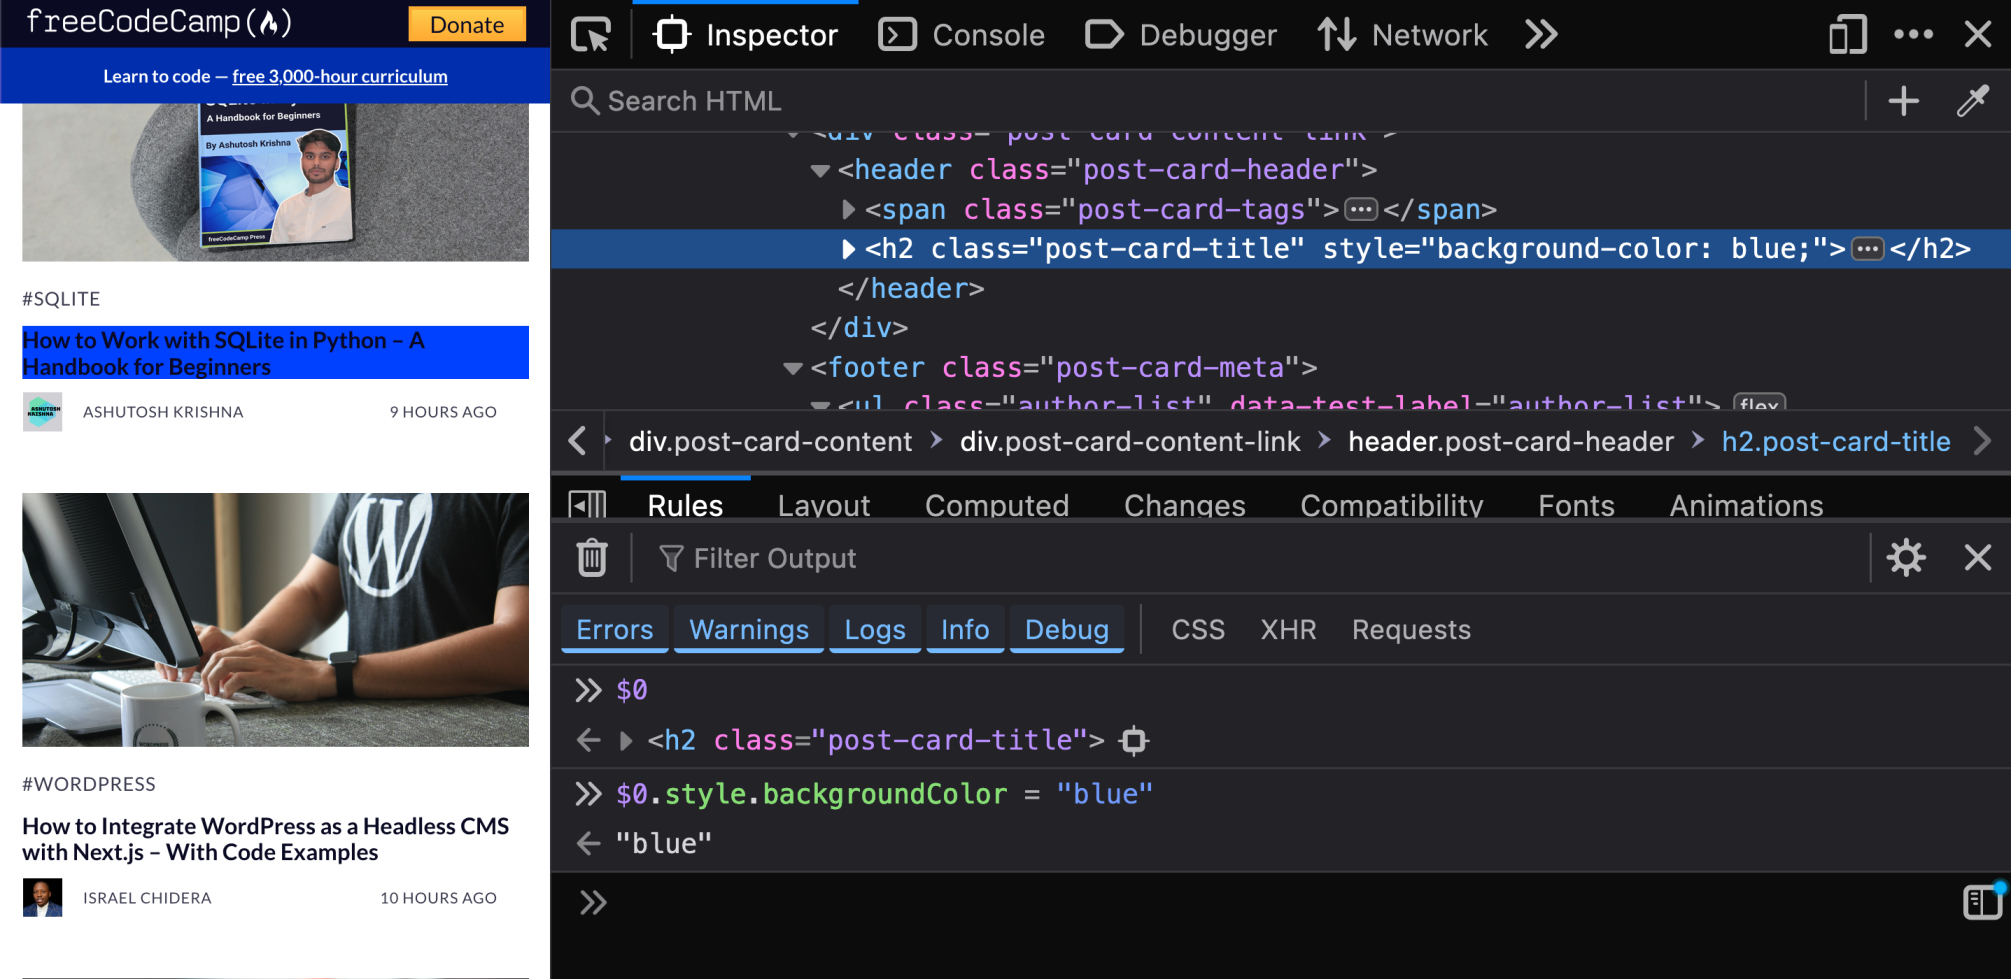
From the image above, we started by inspecting the desired element we wanted in the elements panel. Now, instead of querying the element again using document.querySelector('#element'), you can just use $0 to manipulate it directly like this:
$0.style.backgroundColor = 'lightblue';
This code changes the background color of the selected <div> to a gentle light blue. What really makes $0 useful in this case is that it allows you to refer directly to the exact element you chose in the DOM, making sure that you're working with the correct element, even in cases where elements are dynamically generated or deeply nested.
How to Block Resource Request for Website Testing in DevTools
The Block Resource Request DevTools feature is an important feature for web developers to test how their websites behave when specific resources cannot be loaded.
This feature enables you to simulate situations where an image, JavaScript, CSS, or an entire domain becomes unreachable, and you get to see how your webpage would behave in that situation.
Resources requested by the browser aren’t always guaranteed to be downloaded, which can lead to unexpected experiences for users of your website. You can block requests to a resource on Chrome, Firefox, and Edge and test how your site behaves.
On Chrome and Edge:
On the Network panel, right-click on the resource you want to block and select Block request URL.
Refresh the website, and the blocked resource won’t be downloaded and won’t affect the webpage.
In the image below, we are using the Block request URL option in the Network tab to block a CSS request and see how the web page will look like if the selected CSS file fails to load.
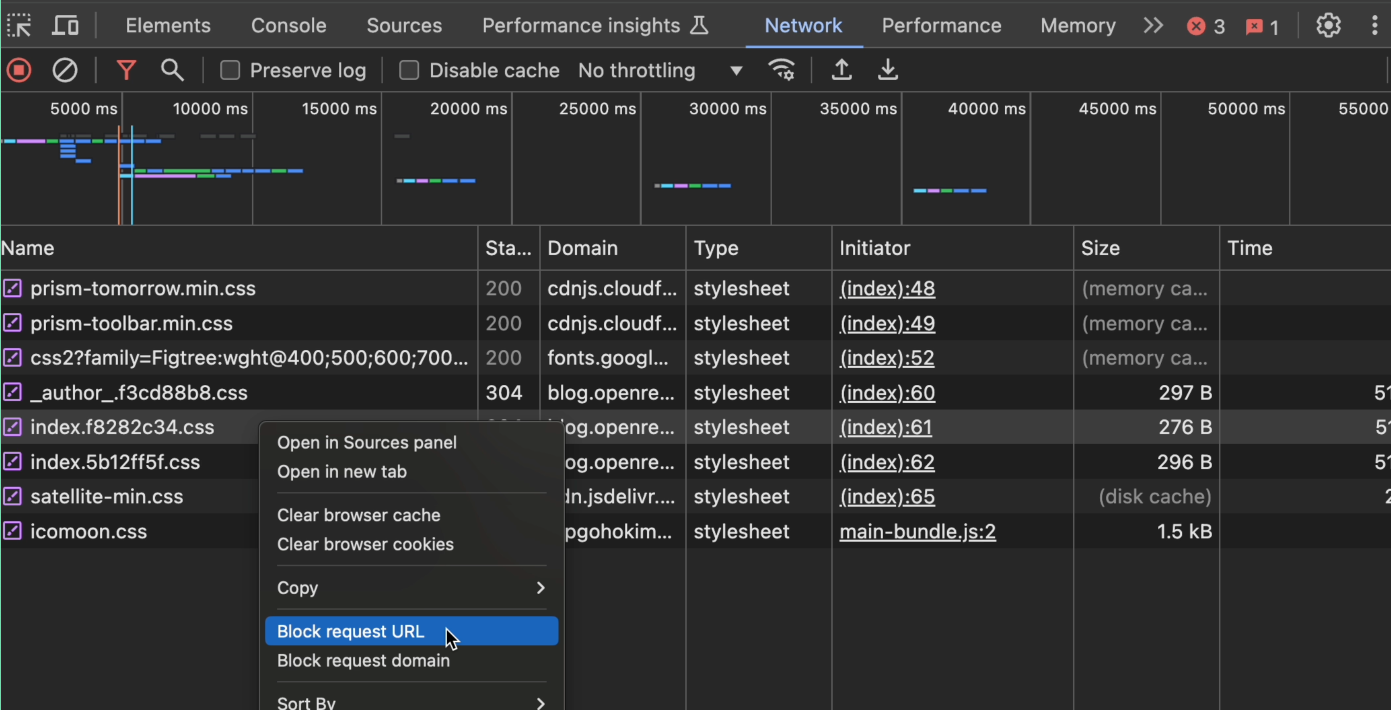
From the image above, we can see all the network requests made by the webpage including requests for images, CSS files, JavaScript files, and so on. In my case I've filtered for just CSS files to be shown only.
From here, you can right-click on the CSS file in the Network panel and select Block request URL. This action will prevent the browser from loading the specific CSS file the next time the page is refreshed.
By blocking the request, we can watch out for weird behaviors and also measure how the absence of the blocked resource can affect the page load time and performance.
On Firefox:
On the Network panel, right-click on the resource you want to block and select Block URL.
Reload the page.
I’ve used this to test how my site behaves when I don’t load a particular JavaScript file. This feature can help developers debug issues that can arise when users disable JavaScript.
How to Edit and Resend Network Request in DevTools
One of the coolest DevTools features is the ability to edit and resend network requests right in the browser. This feature can be really useful for debugging a network request problem. For example, scenarios where you’d want to see how changes to request parameters, headers, or body affect the response from the server, without having to make any changes to the frontend code or restarting the entire request process.
When making a network request, requests made to a backend service might fail or not respond with the intended data. It’s a pain to have to reload the whole page to retry the request, which is why the Edit and Resend feature is helpful.
In the Edge and Firefox browser, you can edit and resend a network request by right-clicking on the request you want to edit or resend and select Edit and Resend, just like in the image below.
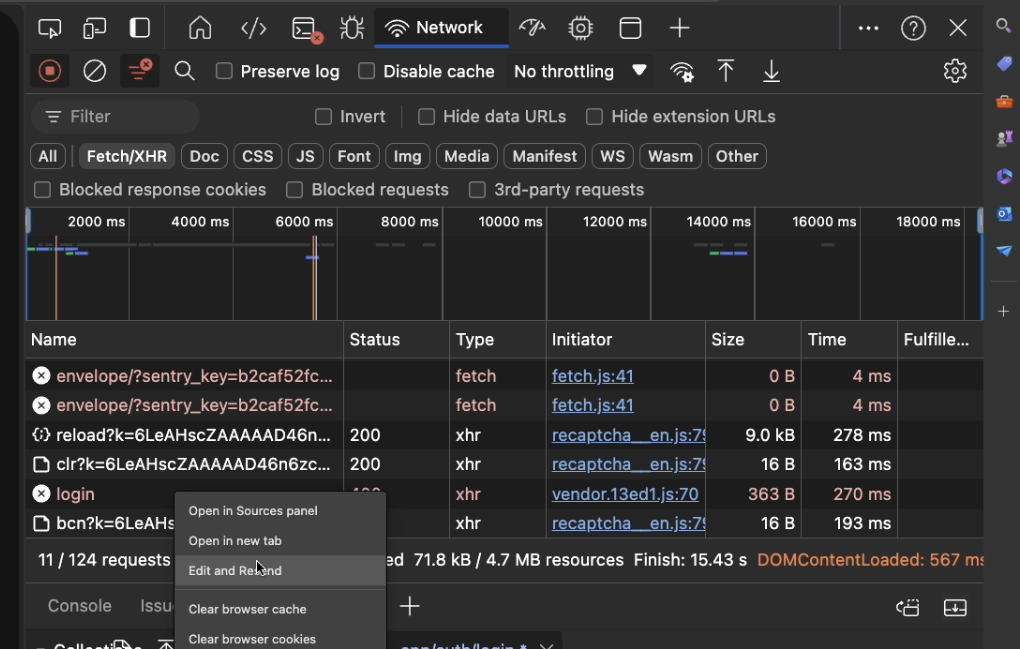
In the image above, we tried to log into a website. When a user submits their credentials, the form sends a POST request to an API endpoint, /auth/login, with the user’s username and password.
Sometimes, the server may return a 400 Bad Request error, and for us to debug the error and find out why, we have to retry the request. We don't want to keep on filling out the form, so we use the Edit and Resend feature as shown below.
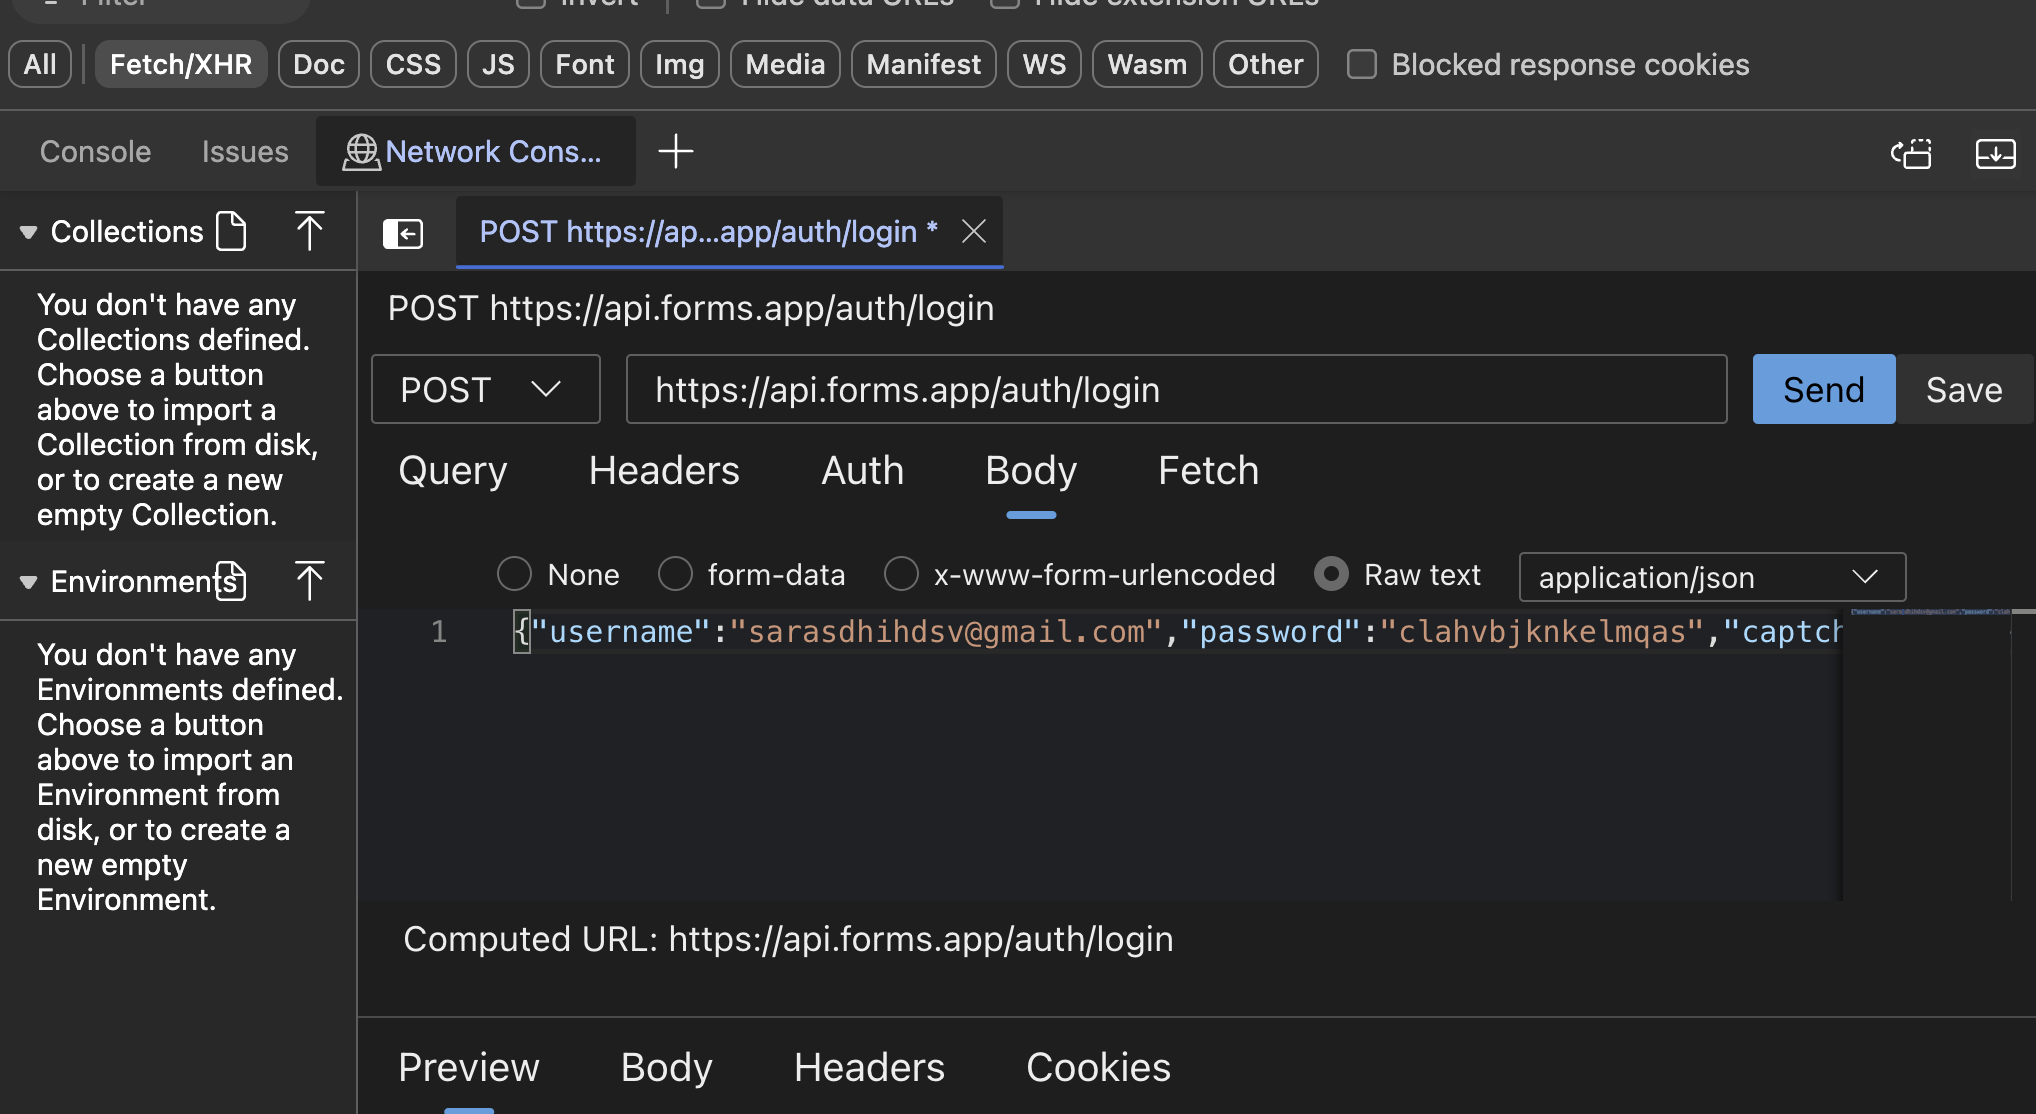
The image above is the network Console or a sidebar that will open when you click on Edit and Resend, showing the details of the request. Here, you can edit:
URL: If necessary, you can modify the URL or add query parameters.
Headers: You might notice a missing or incorrect Content-Type header, which you can fix here.
Body: This is where you can adjust the payload, such as correcting the username or password fields.
In Chrome browsers, the edit and resend feature only works for XHR requests, and you can use it by right-clicking on the request and selecting replay.
How to Detect Unused Source Code in DevTools
The Coverage tool in DevTools enables developers to spot areas of their JavaScript and CSS files that remain unused during the loading and interaction stages of a webpage. It's an important feature for enhancing web performance by reducing file sizes and eliminating unnecessary code for faster page load times and a better user experience.
Removing unused JS and CSS code is a great way to save your users bandwidth. The Coverage tool allows you to find the unused code in your source code, and either remove it or defer it till the piece of code is needed.
On Chrome and Edge:
In DevTools, press
Ctrl/cmd+Shift+P, type coverage and select Start instrumenting coverage, refresh the page, then hit enter.You’ll see a table of JS and CSS files with an unused byte column.
Click on any of the files to open it. The line by the side indicates which section of code isn’t unused in red.
In the image below, we are identifying the unused CSS code to potentially remove or defer the loading of the code.
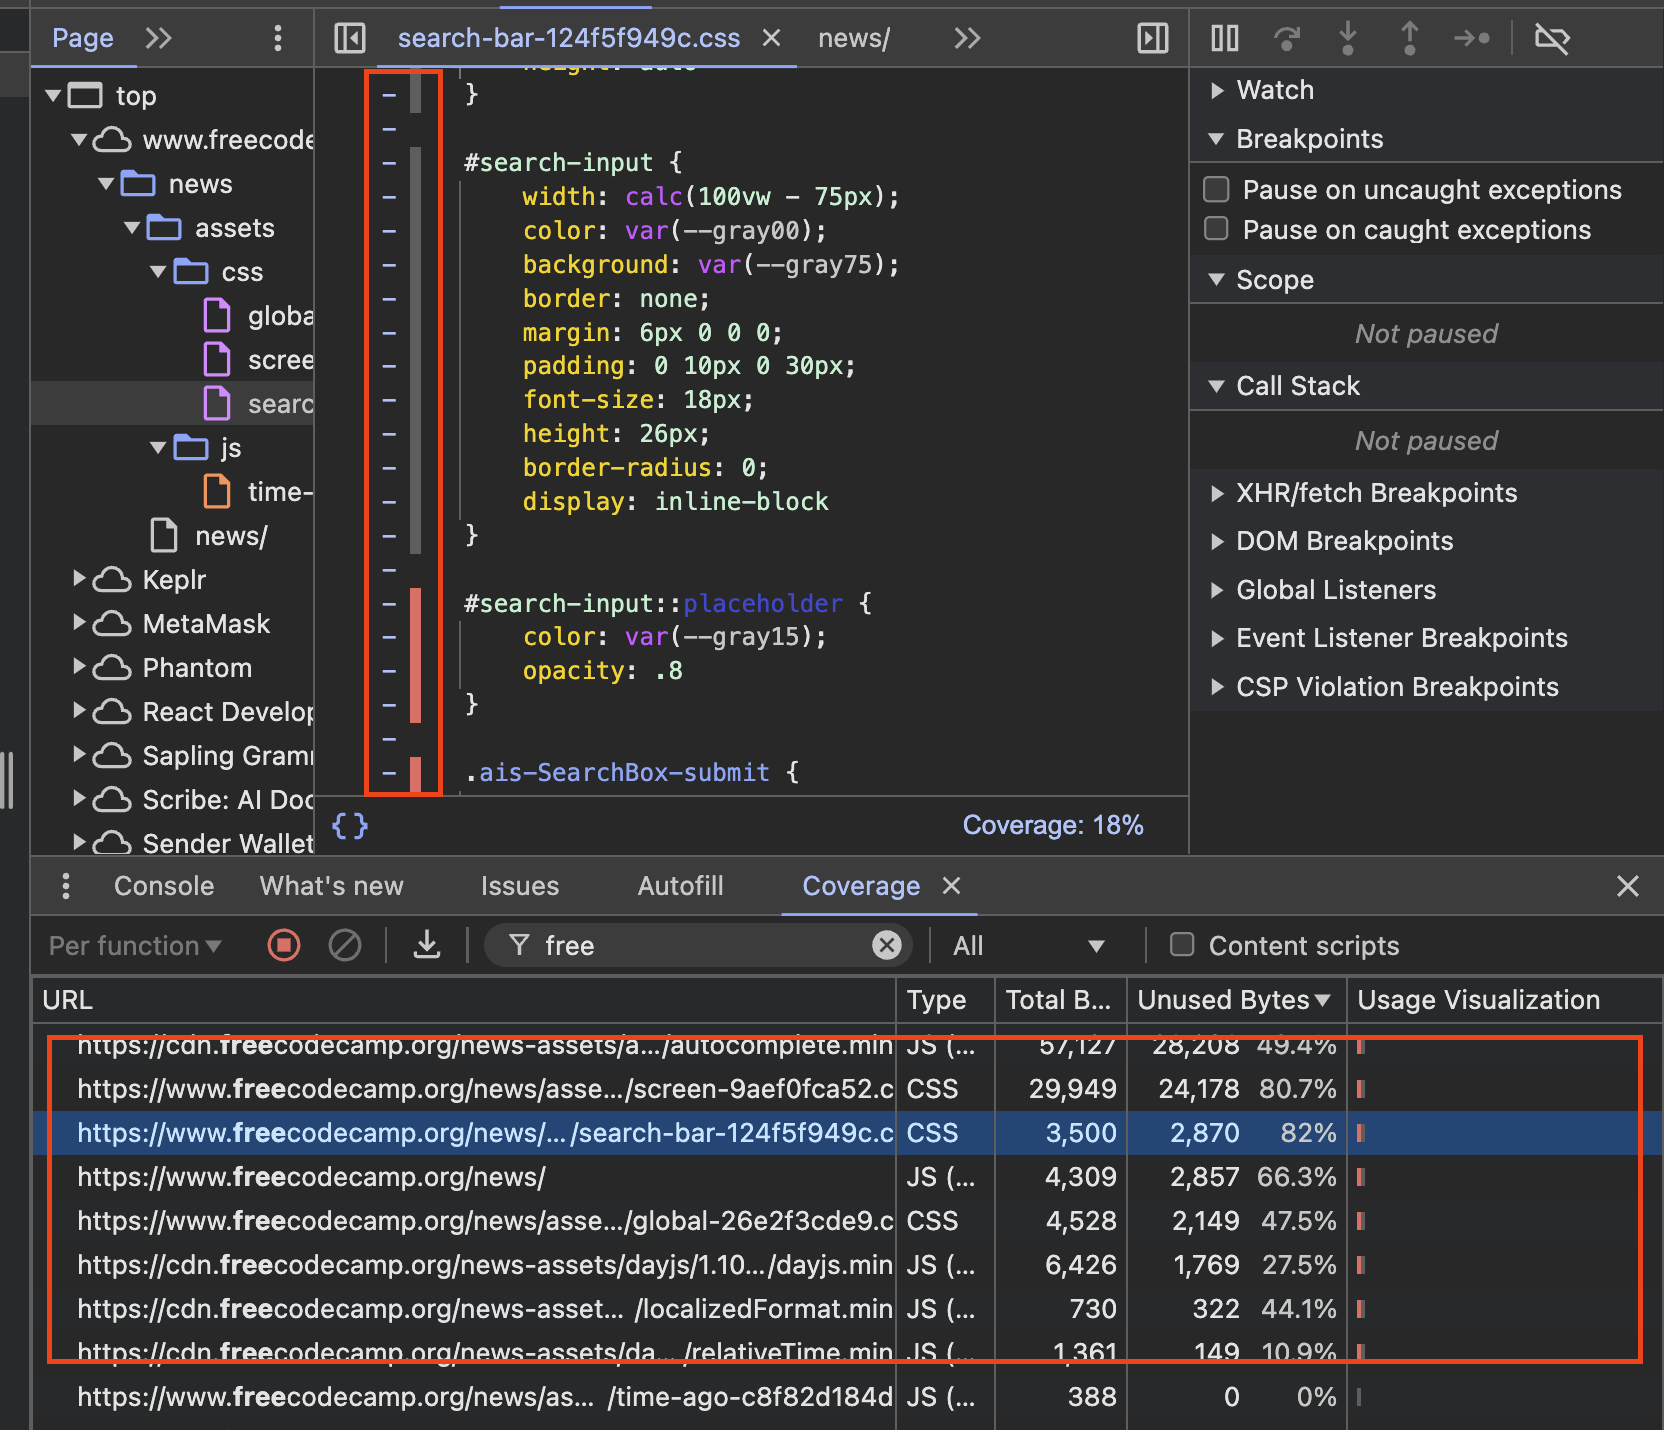
From the image above, after the recording is complete, the Coverage tool will display a list of CSS and JavaScript files loaded by the page, along with detailed metrics:
Total Bytes: The size of the file.
Unused Bytes: The number of bytes in the file that were not used.
Usage Visualization: A visual bar representing the proportion of used versus unused code.
On Safari: In the Sources panel, open the left navigation sidebar and click on any JS file. At the top right of the toolbar, click on the coverage icon c and refresh your page. You'd be able to see that the sections of code not executed are grayed out.
How to Enable Accessibility Tree in DevTools
The accessibility tree is similar to the element DOM tree and is used by assistive technologies such as screen readers to read web content. Developers can use this feature to debug accessibility issues on their websites. Chromium browsers use Chrome’s accessibility API to make this possible, while Firefox has its own accessibility tool.
On Chrome and Edge:
On the settings page, select the Experiments tab.
Check the box for the Enable full accessibility tree view option in the Elements panel.
Refresh DevTools and go to the Elements tool.
In the top-right corner of the element view, click Switch to DOM Tree view.
For example, in the image below, we are checking if the links and buttons on our website are recognized correctly and accessible to users who rely on screen readers:
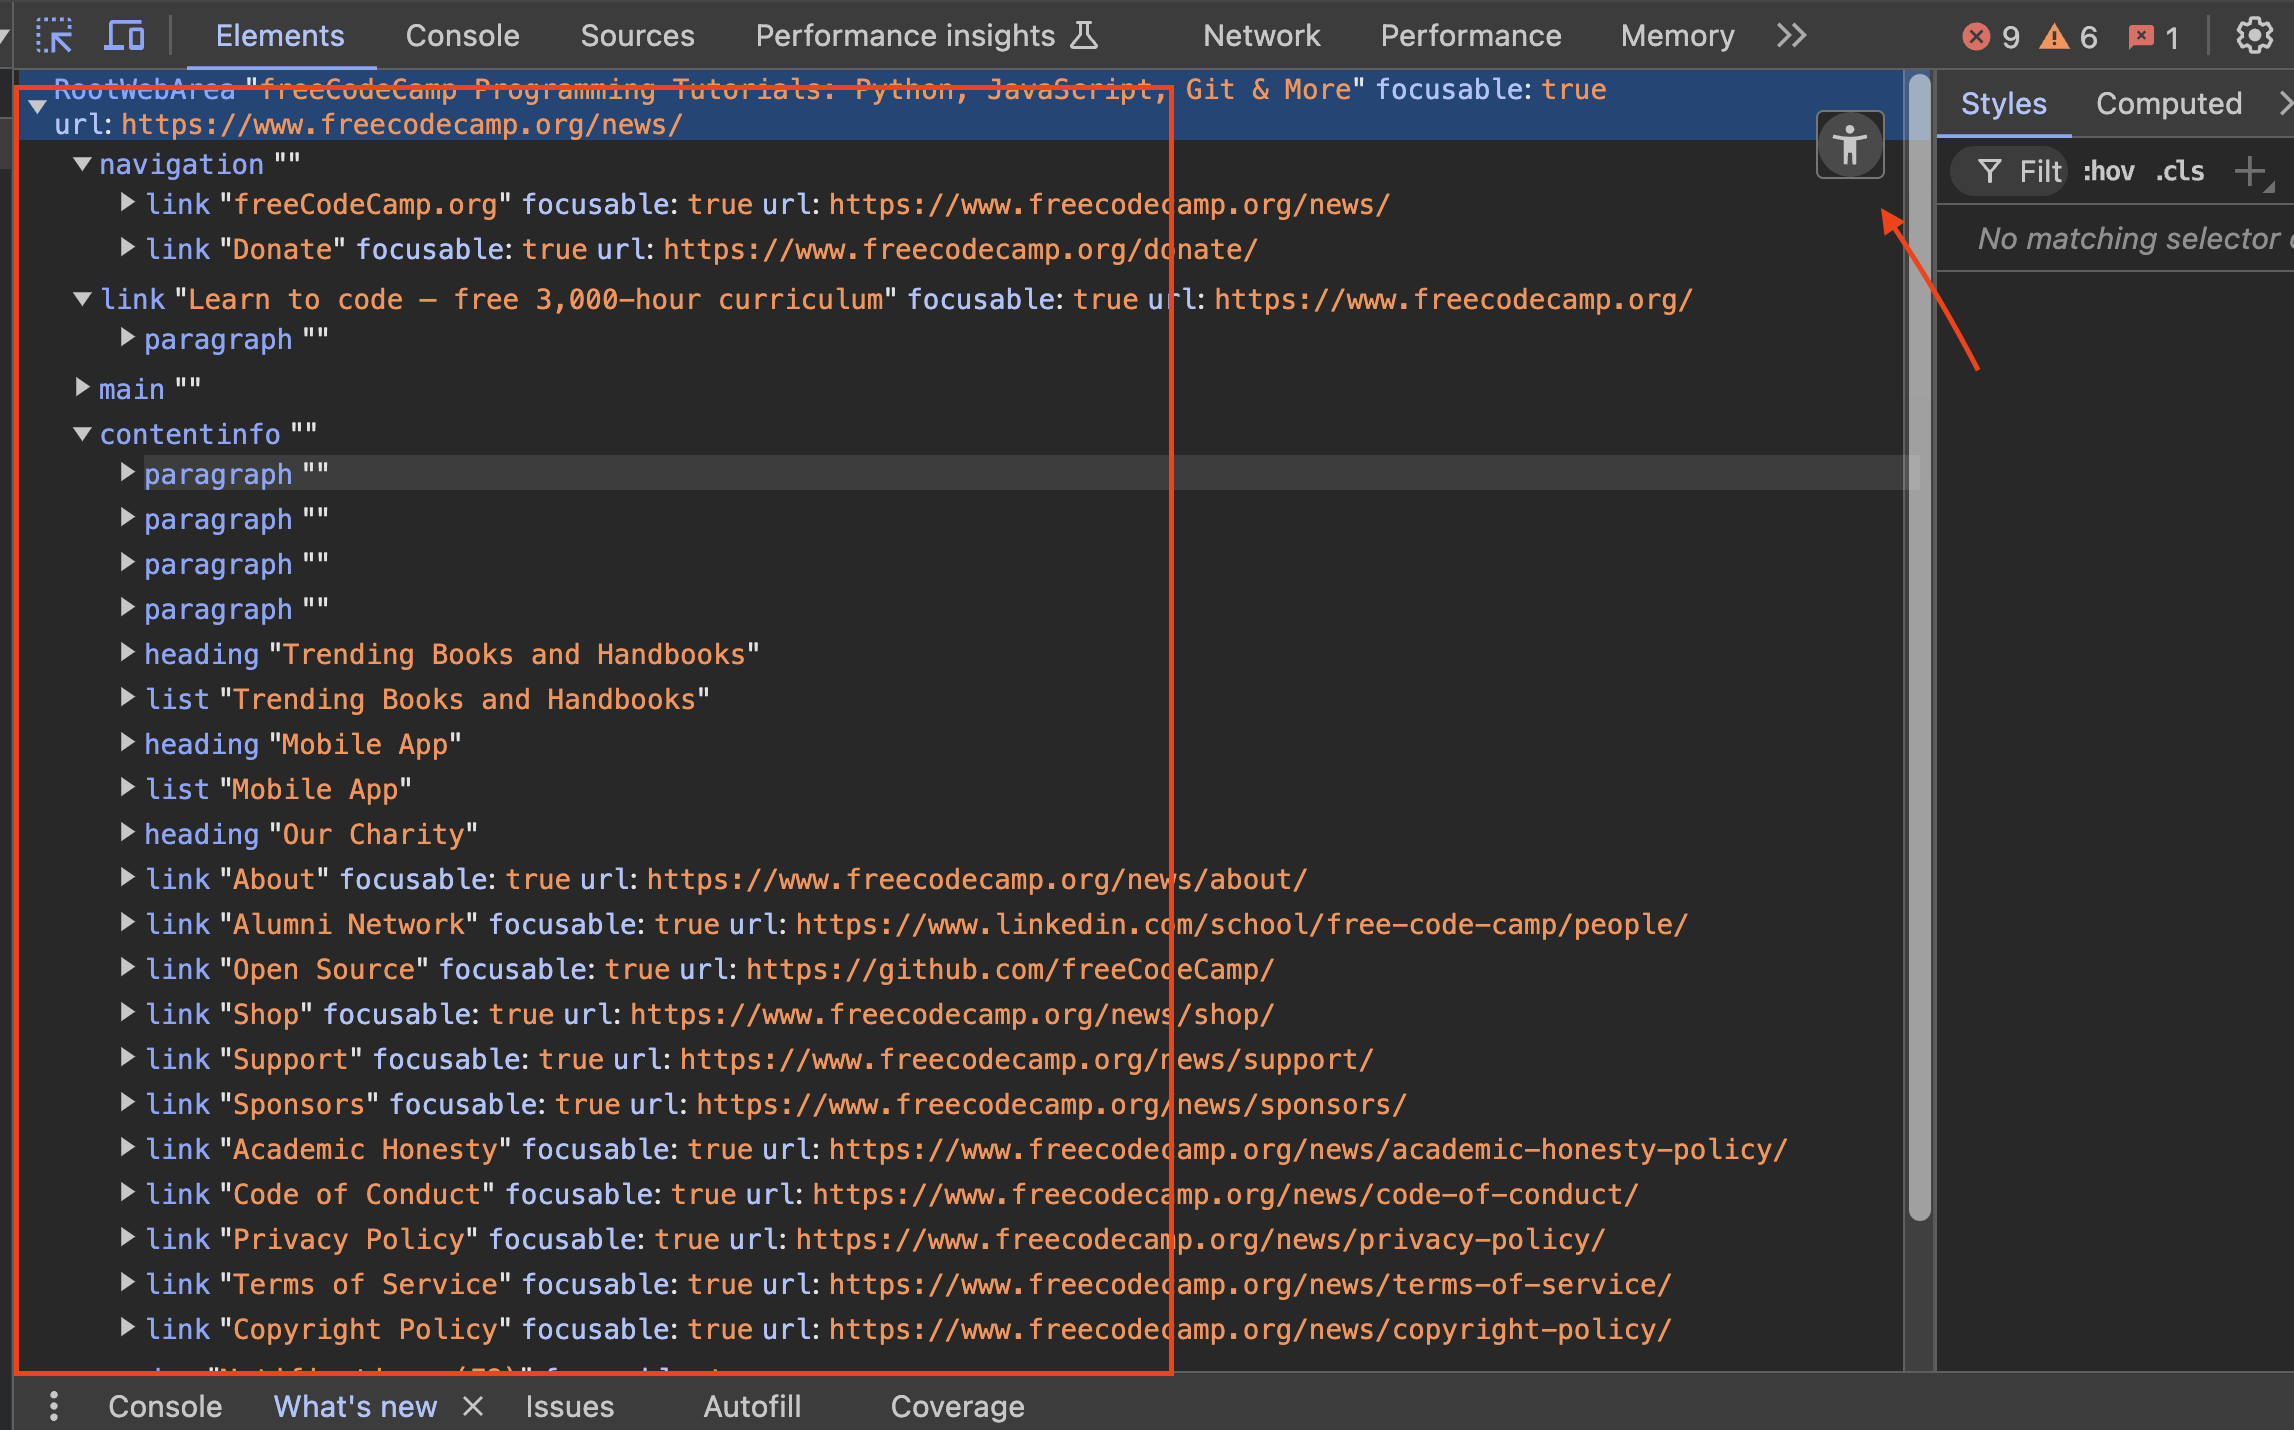
With the accessibility tree enabled, you can see a simplified version of the DOM tree, focused on elements relevant for accessibility. When you select an element on the accessibility tree to view its properties, the tree displays the element’s role, name, and other important attributes, such as aria-label if they are present.
You’ll also see if the element is focusable and what its computed accessibility properties are.
This helps a great deal because if the element isn’t appearing correctly in the accessibility tree or is missing essential attributes, you may need to adjust your HTML or ARIA attributes to improve accessibility.
On Firefox:
In the Firefox DevTools, click on the accessibility tab and expand the document node.
You can click on different nodes to view their properties.
Accessibility issues for nodes will be displayed on the Checks tab.
Summary
In a nutshell, staying current with the latest cross-browser DevTools features will save you time as a web developer. This post touches on element inspection tips, some Console shortcuts to make your debugging process easier, and some useful tips for network monitoring.
Hopefully, you will keep exploring and using more DevTools features to improve your developer experience.