

Charts look like a small task on a ticket. Then you open the Recharts docs and remember how much setup every chart needs: a config object for labels and colors, axes, a tooltip, a legend, colors that work in dark mode, and a container that resizes properly. Most of us copy all of that from the last project and rename the keys.
The shadcn/ui chart component removes part of this work. It wraps Recharts with theme-aware colors and tooltips. But you still write every chart by hand.
So I built ChartCN, a free and open-source shadcn chart generator. You paste your data, pick a chart, and copy one TSX file that depends only on the shadcn/ui chart component and Recharts. It's MIT licensed, and there's no account or extra package.
In this tutorial, you'll learn how to add a revenue-versus-expenses bar chart to a fresh Next.js app. We'll walk through what each part of the generated code does, and then connect the chart to data loaded in a Server Component. The tool saves you the typing, but Steps 5 and 6 apply to any shadcn/ui chart, whether you generate it or write it yourself.
Prerequisites: You should be comfortable with React and have Node.js installed. Basic familiarity with the Next.js App Router helps, but every step is explained.
Table of Contents
What You'll Build
By the end, you'll have two pages:
/shows a grouped bar chart with the data written directly in the component. This is the fastest way to get a chart on screen./liveshows the same chart, but the data comes from an async function running on the server. This is the version you'd use with a real database or API.
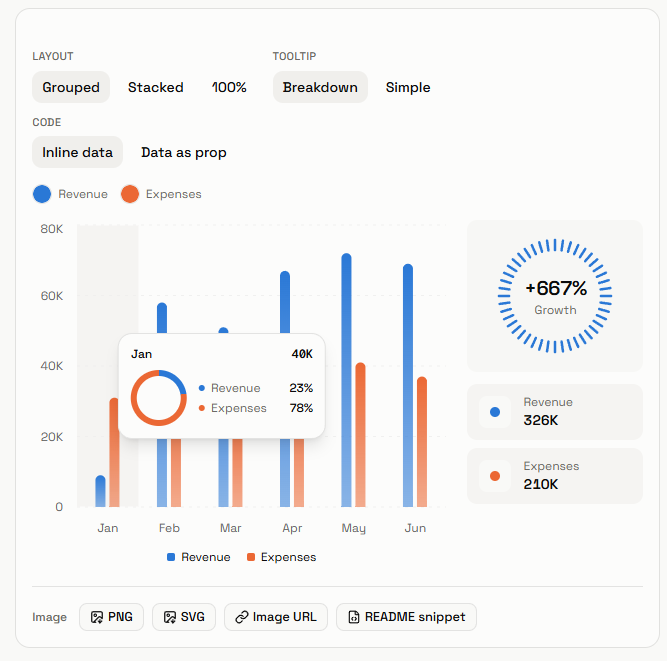
The chart has gradient bars, compact axis labels (40K instead of 40000), a legend, and a tooltip that shows the month's total and each series' share of it.
Step 1: Create a Next.js App and Initialize shadcn/ui
Create a new app and move into it:
npx create-next-app@latest my-charts-app
cd my-charts-app
Accept the recommended defaults. You need TypeScript, Tailwind CSS, and the App Router.
Next, initialize shadcn/ui:
npx shadcn@latest init
This command does three things you'll rely on later:
It creates
components.json, which tells the shadcn/ui CLI where to put components.It adds
lib/utils.tswith thecn()class-merging helper.It writes theme variables into
app/globals.css, including five chart colors:--chart-1through--chart-5, with separate values for light and dark mode.
Those five chart variables matter. Every generated chart uses them, so changing a chart color across your whole app means editing one line of CSS.
Step 2: Add the shadcn/ui Chart Component
Now add the chart component:
npx shadcn@latest add chart
This installs recharts and creates components/ui/chart.tsx. That file exports the building blocks you'll see in the generated code:
ChartContainerwraps Recharts'ResponsiveContainer, so the chart fills its parent.ChartConfigis the type for the object that maps each data key to a label and a color.ChartTooltip,ChartTooltipContent,ChartLegend, andChartLegendContentare styled versions of the Recharts tooltip and legend.
Before moving on, check which Recharts version was installed:
npm ls recharts
The code ChartCN generates targets Recharts 3. If you see a 2.x version, upgrade it:
npm install recharts@latest
Takeaway: the shadcn/ui chart component is a thin layer over Recharts. It doesn't replace Recharts. It gives Recharts your theme.
Step 3: Generate the Chart Component in ChartCN
Open the ChartCN bar chart page. The data panel has three tabs: Paste data, Upload file, and Edit table. Paste this CSV into the Paste data tab:
Month,Revenue,Expenses
Jan,42000,31000
Feb,58000,34000
Mar,51000,29000
Apr,67000,38000
May,72000,41000
Jun,69000,37000
ChartCN treats the first column as the category axis (the x-axis for a bar chart) and every other column as a numeric series. JSON, TSV, and Markdown tables also work, and the format is detected automatically.
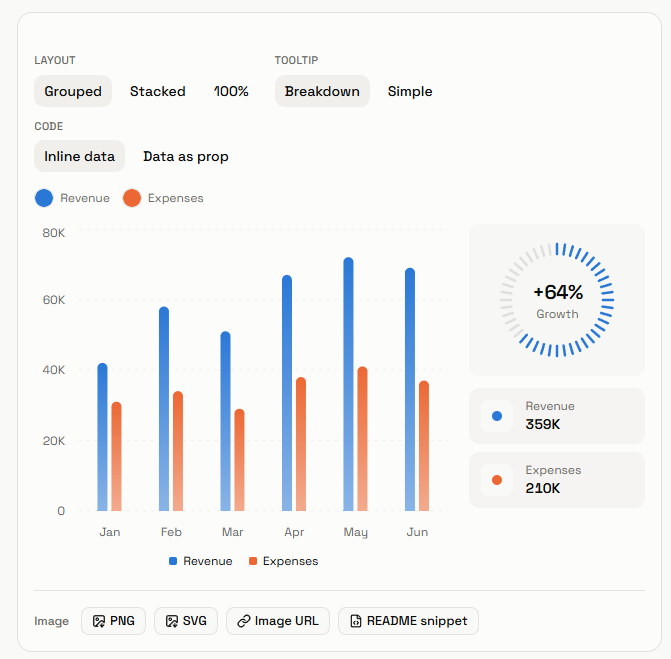
Above the preview, set these options:
Layout: Grouped
Tooltip: Breakdown
Code: Inline data
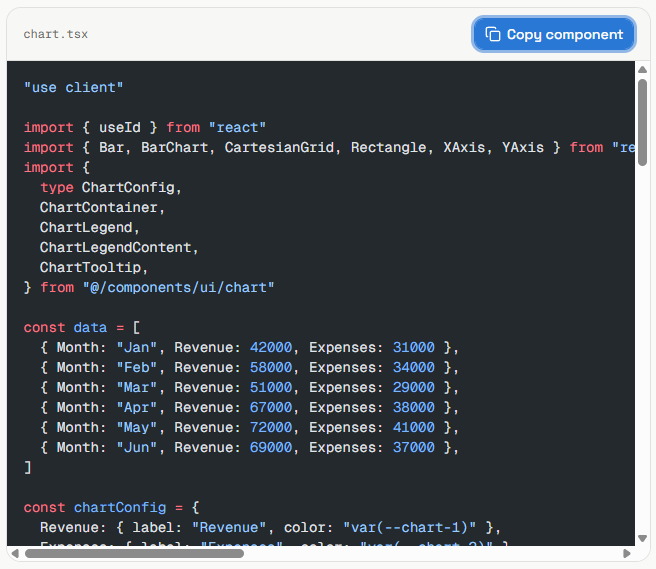
Then click Copy component in the chart.tsx panel below the preview.
Step 4: Add the Chart to Your Page
Create a new file at components/revenue-chart.tsx and paste the copied code into it.
Don't save it as components/ui/chart.tsx. ChartCN labels its output chart.tsx, but that path already holds the shadcn component from Step 2, and overwriting it breaks every chart in your app.
The generated component is always exported as Chart, so give it a clearer name when you import it. Replace app/page.tsx with this:
// app/page.tsx
import { Chart as RevenueChart } from "@/components/revenue-chart"

export default function Home() {
  return (
    <main className="mx-auto max-w-3xl p-8">
      <h1 className="mb-6 text-2xl font-semibold">Revenue vs. expenses</h1>
      <RevenueChart />
    </main>
  )
}
Run npm run dev and open http://localhost:3000. You should see the chart.
Takeaway: a generated chart is just a component in your project. There's nothing to configure and no package to keep in sync.
Step 5: Understand the Generated Code
You own this file now, so it's worth knowing what each part does. Here are the important pieces, trimmed for length.
The file starts with a directive and its imports:
// components/revenue-chart.tsx
"use client"

import { useId } from "react"
import { Bar, BarChart, CartesianGrid, Rectangle, XAxis, YAxis } from "recharts"
import {
  type ChartConfig,
  ChartContainer,
  ChartLegend,
  ChartLegendContent,
  ChartTooltip,
} from "@/components/ui/chart"
Recharts measures the DOM and handles mouse events, so the chart must be a Client Component. app/page.tsx can stay a Server Component because it only renders the chart.
Next come the data and the config:
const data = [
  { Month: "Jan", Revenue: 42000, Expenses: 31000 },
  { Month: "Feb", Revenue: 58000, Expenses: 34000 },
  // ...
]

const chartConfig = {
  Revenue: { label: "Revenue", color: "var(--chart-1)" },
  Expenses: { label: "Expenses", color: "var(--chart-2)" },
} satisfies ChartConfig
The keys in chartConfig must match the keys in your data. ChartContainer reads this config and creates a CSS variable for each key, scoped to this chart: --color-Revenue and --color-Expenses. Each one points at a theme color, so the chart switches colors in dark mode on its own.
The chart itself uses those variables:
<ChartContainer config={chartConfig} className="aspect-auto h-[350px] w-full">
  <BarChart accessibilityLayer data={data} barCategoryGap="30%" barGap={4}>
    {/* ...gradient <defs>, grid, axes, tooltip, legend... */}
    <Bar
      dataKey="Revenue"
      fill="var(--color-Revenue)"
      shape={(props) => <Rectangle {...props} fill={`url(#${uid}-fill-0)`} />}
      radius={[6, 6, 0, 0]}
      maxBarSize={36}
    />
  </BarChart>
</ChartContainer>
A few details are worth knowing:
Height is set by
h-[350px]onChartContainer. Change it there.The gradient is drawn by the
shapeprop, whilefillstays a solid color. That's why the legend and tooltip dots show a clean color instead of a gradient.uidcomes fromuseId(), so the gradient IDs stay unique if you render two charts on the same page.
The file also includes a ChartBreakdownTooltip component, about 70 lines, that shows the total and each series' percentage. If you'd rather use the standard shadcn tooltip, pick Tooltip: Simple in ChartCN before copying. The whole file then drops from about 120 lines to about 50.
Takeaway: in shadcn/ui charts, colors flow from theme variables through chartConfig into --color-<key> variables. Once you understand that path, you can edit any chart by hand.
Step 6: Pass Live Data as a Prop
Hardcoded data is fine for a demo. For real data, go back to ChartCN, switch Code to Data as prop, and copy again. Save this version as components/revenue-chart-live.tsx.
The chart markup is identical. Only the top of the file changes: the data array is replaced by a type, and the component accepts data as a prop:
// components/revenue-chart-live.tsx
export type ChartRow = { Month: string; Revenue: number | null; Expenses: number | null }

export interface ChartProps {
  data: ChartRow[]
}

// ...chartConfig is unchanged...

export function Chart({ data }: ChartProps) {
  // ...same JSX as before
}
The series are typed as number | null because real data has gaps. A null value renders as a missing bar, not as a bar of zero.
Now create a function that loads the data on the server:
// lib/get-revenue.ts
import type { ChartRow } from "@/components/revenue-chart-live"

export async function getRevenue(): Promise<ChartRow[]> {
  // Replace this with your database query or API call.
  // For example: const res = await fetch("https://api.example.com/revenue")
  return [
    { Month: "Jan", Revenue: 42000, Expenses: 31000 },
    { Month: "Feb", Revenue: 58000, Expenses: 34000 },
    { Month: "Mar", Revenue: 51000, Expenses: 29000 },
    { Month: "Apr", Revenue: 67000, Expenses: 38000 },
    { Month: "May", Revenue: 72000, Expenses: null },
  ]
}
Then call it from a Server Component page:
// app/live/page.tsx
import { Chart as RevenueChart } from "@/components/revenue-chart-live"
import { getRevenue } from "@/lib/get-revenue"

export default async function LivePage() {
  const data = await getRevenue()

  return (
    <main className="mx-auto max-w-3xl p-8">
      <h1 className="mb-6 text-2xl font-semibold">Revenue vs. expenses</h1>
      <RevenueChart data={data} />
    </main>
  )
}
Open http://localhost:3000/live. May shows a Revenue bar with no Expenses bar next to it, because that value is null.
The page fetches on the server and sends only the rows to the client component. Your database credentials and API keys stay on the server. When you swap in a real fetch or database call, check the Next.js data fetching docs to control how often the data refreshes.
Takeaway: keep data loading in a Server Component and rendering in a Client Component. The exported ChartRow type makes TypeScript check that your data matches what the chart expects.
Common Issues and How to Fix Them
Type errors such as "Property 'itemSorter' does not exist". Your project has Recharts 2 installed. Run npm install recharts@latest to upgrade to Recharts 3.
The bars are black and the legend dots are missing. Your app/globals.css doesn't define --chart-1 through --chart-5. Run npx shadcn@latest init again, or copy the chart variables from the shadcn/ui theming docs.
Every chart stopped working after you pasted one. You probably saved the generated file over components/ui/chart.tsx. Restore it with npx shadcn@latest add chart --overwrite and save your chart under a different name.
Two charts on one page have the same name. Every generated component is exported as Chart. Rename it when you import it, for example import { Chart as SignupsChart } from "@/components/signups-chart".
Summary
The shadcn/ui chart component themes Recharts. It doesn't replace it, and ChartCN's output requires Recharts 3.
Colors flow from CSS variables.
--chart-1becomes--color-RevenuethroughchartConfig, so dark mode works without extra code.Save generated charts under their own names.
components/ui/chart.tsxbelongs to shadcn/ui.Use Data as prop for real data. Load it in a Server Component and pass the typed rows to the chart.
nullmeans "no data". Gaps render as gaps, not as zeros.
Because ChartCN is a shadcn chart generator rather than a component library, there is no ChartCN package to install or keep updated. You can browse all 13 shadcn charts it supports, including line, area, pie, radar, KPI cards, waterfall, and a heatmap. They all follow the same paste, pick, and copy workflow you used here.
The source is on GitHub under the MIT license. If it's useful, a star helps other developers find it.


