
As a developer, you'll likely work on a complex project at some point where deciphering the codebase feels like reading a whole novel. Engineers are code wizards, but even the best get lost in sprawling code.
The challenge is that architecture diagrams – if they even exist – are often outdated relics from a bygone era.
This is why creating and maintaining effective and clear diagrams should be effortless. Up-to-date visuals ensure everyone stays on the same page, eliminating confusion and wasted time.
Table of Contents
What is the C4 Model?
The C4 model was created as a way to help software development teams describe and communicate software architecture.
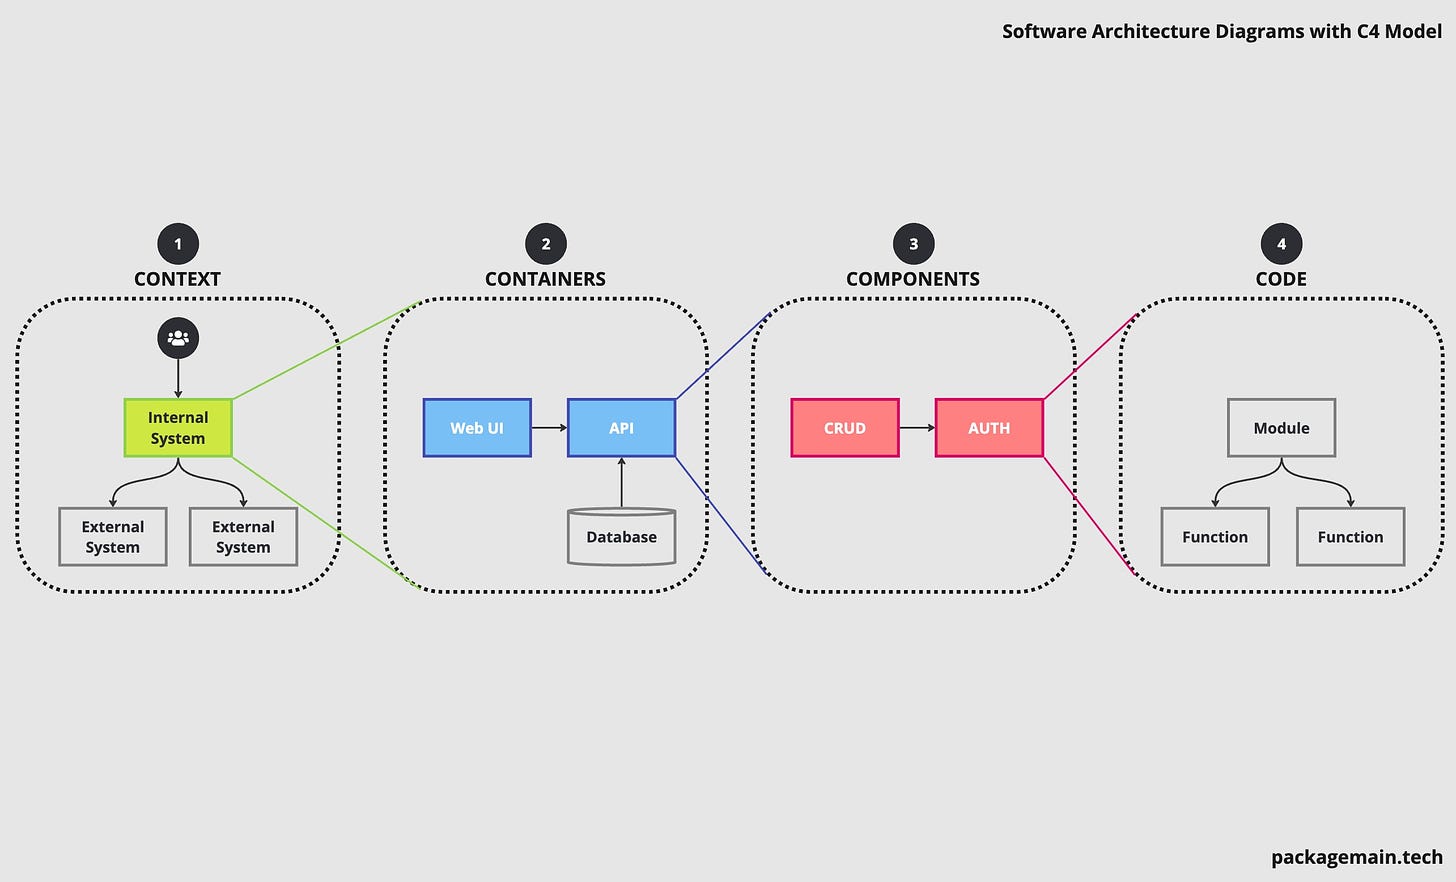
C4 stands for “Context, Containers, Components, and Code”. Those are the four levels that should be enough to describe a complex system.
The best way to explain the concept is to think about how we use Google Maps. When we are exploring an area in Google Maps, we will often start zoomed out to help us get context. Once we find the rough area we are interested in we can zoom in to get a little more detail.
Level 1: Context
This level is the most zoomed out. It's a bird’s eye view of the system in the greater context of the world. The diagram concentrates on actors and systems.
For the examples below, we will use a simple Task Management Software System to demonstrate all these 4 levels.
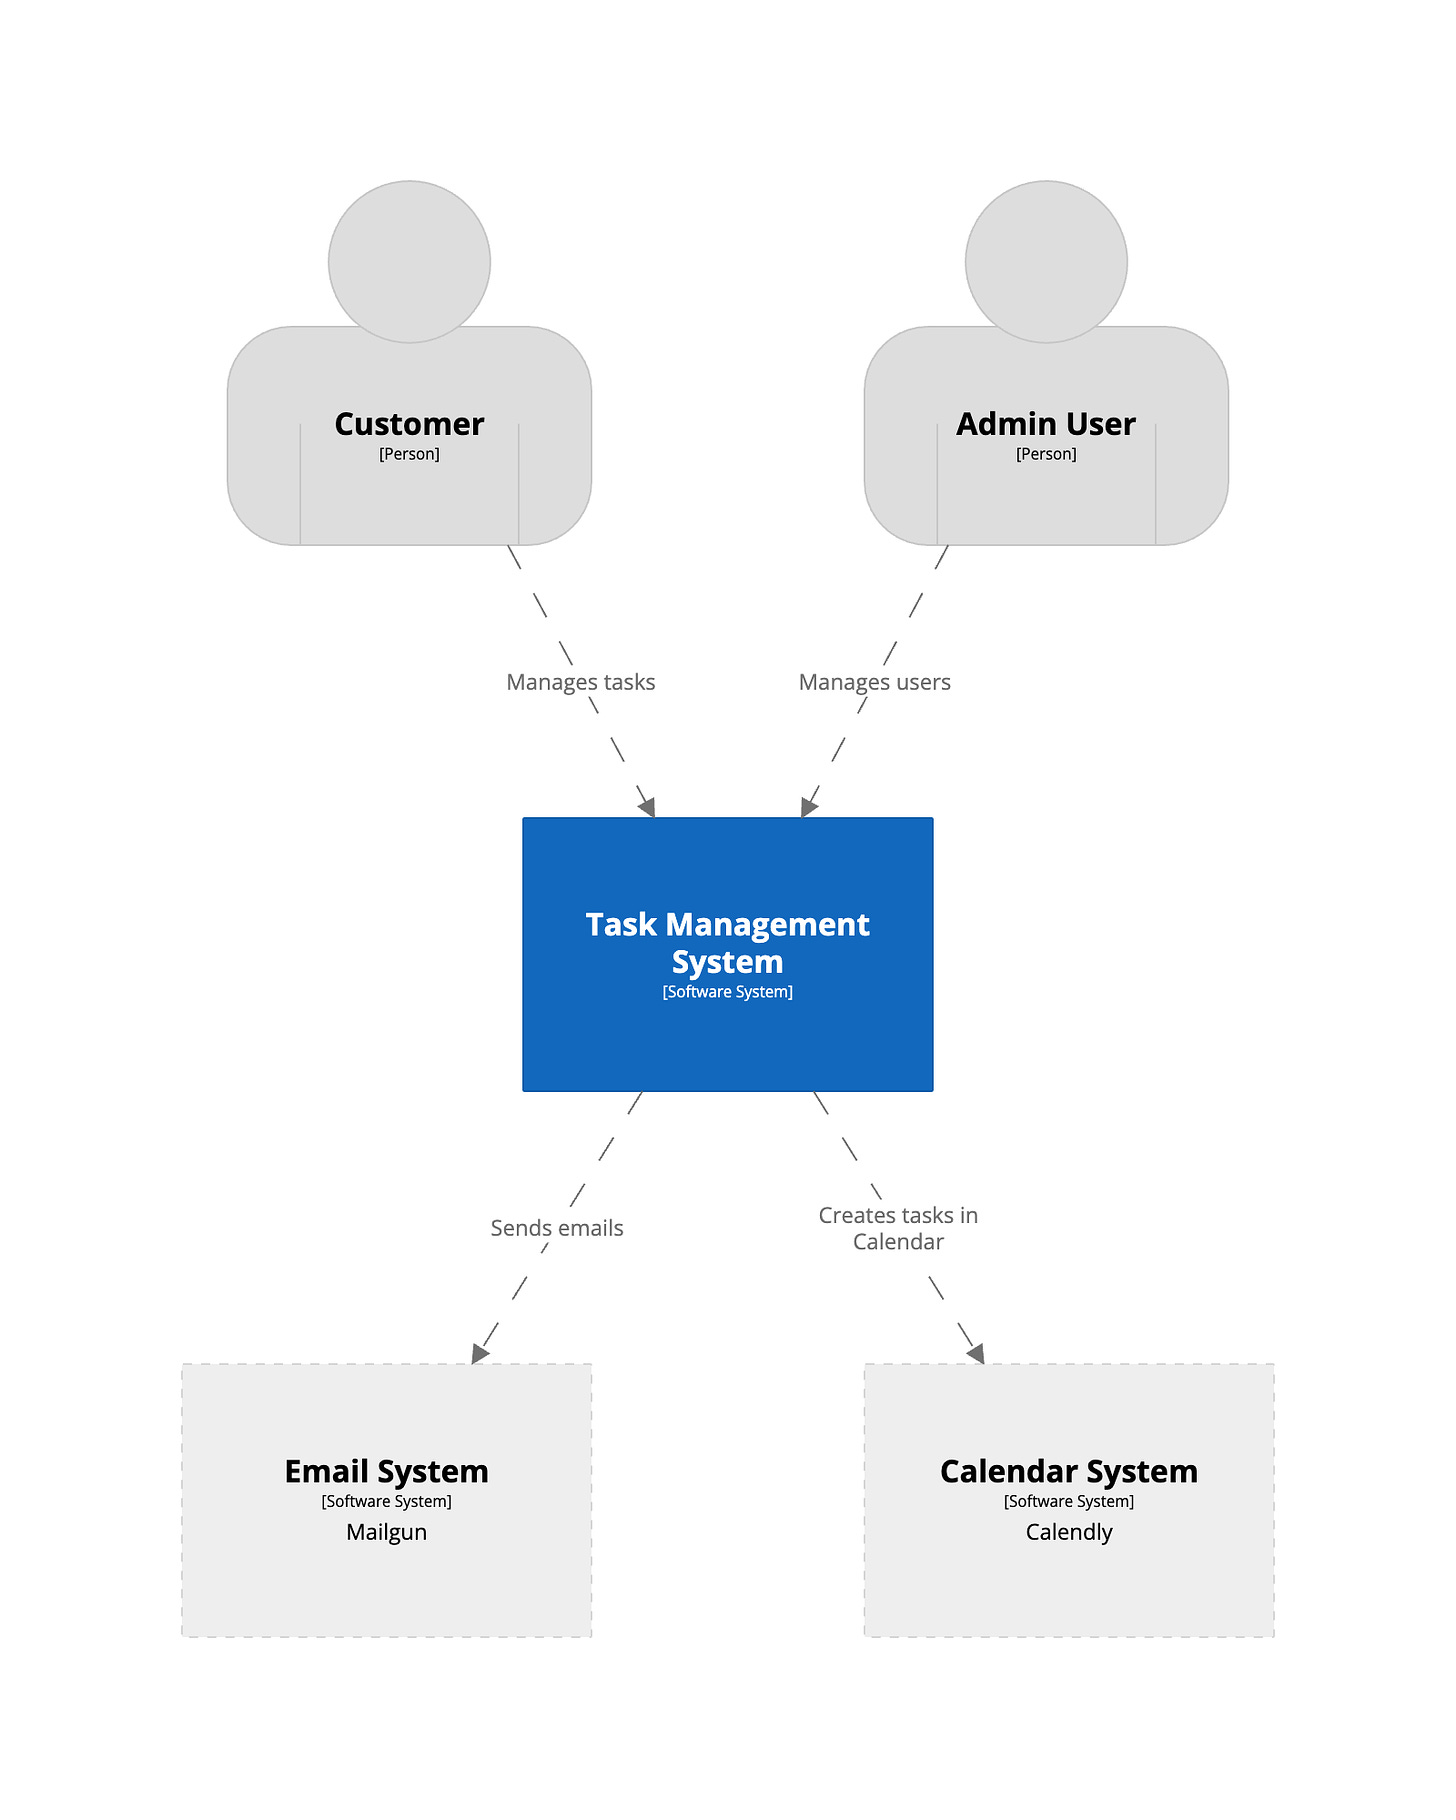
This diagram portrays the Task Management Software System's interactions with external systems and the different user groups that utilize it. We can see that the Task Management software relies on two external systems: Email and Calendar, and two types of actors (users) use it: Customer and Admin User.
Level 2: Containers
The containers level is a more detailed view of your system (don’t confuse C4 containers with Docker containers).
It reveals how various functional units like applications and databases work together and distribute responsibilities.
This diagram also highlights the key technologies employed and showcases the communication flow between these containers. It presents a simplified, technology-centric view of the system's core components and their interactions.
If you have Microservice architecture, then each Microservice would be a container.
Examples of containers are:
Single page application
Web server
Serverless function
Database
API
Message buses
And so on.
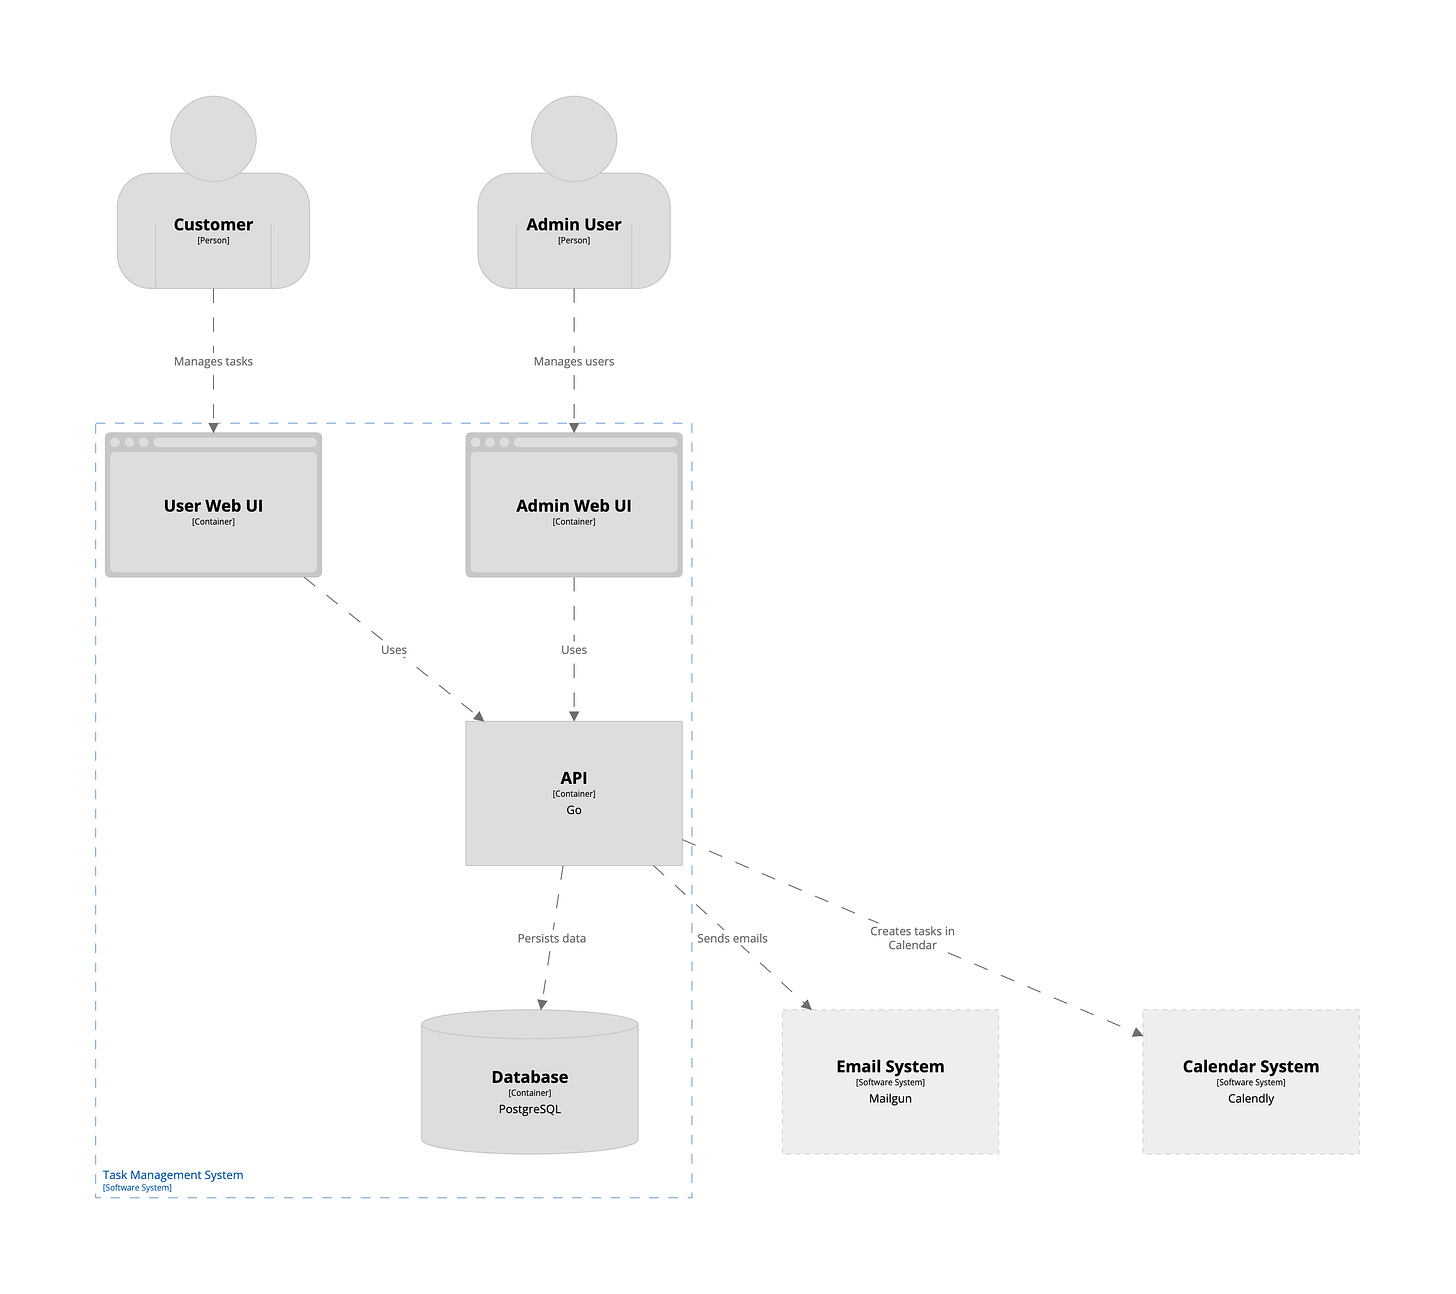
This level delves into the internal composition of the Task Management Software System. It showcases that our Task Management software system consists of containers such as User Web UI, Admin Web UI, API and a Database. API is also the container that is connected to external systems, for example to send emails or create events in calendar.
Level 3: Components
The next level of zoom is components. This shows the major structural building blocks of your application, and is often a conceptual view of the application. The term component is loose here. It could represent a controller or a service containing business logic.
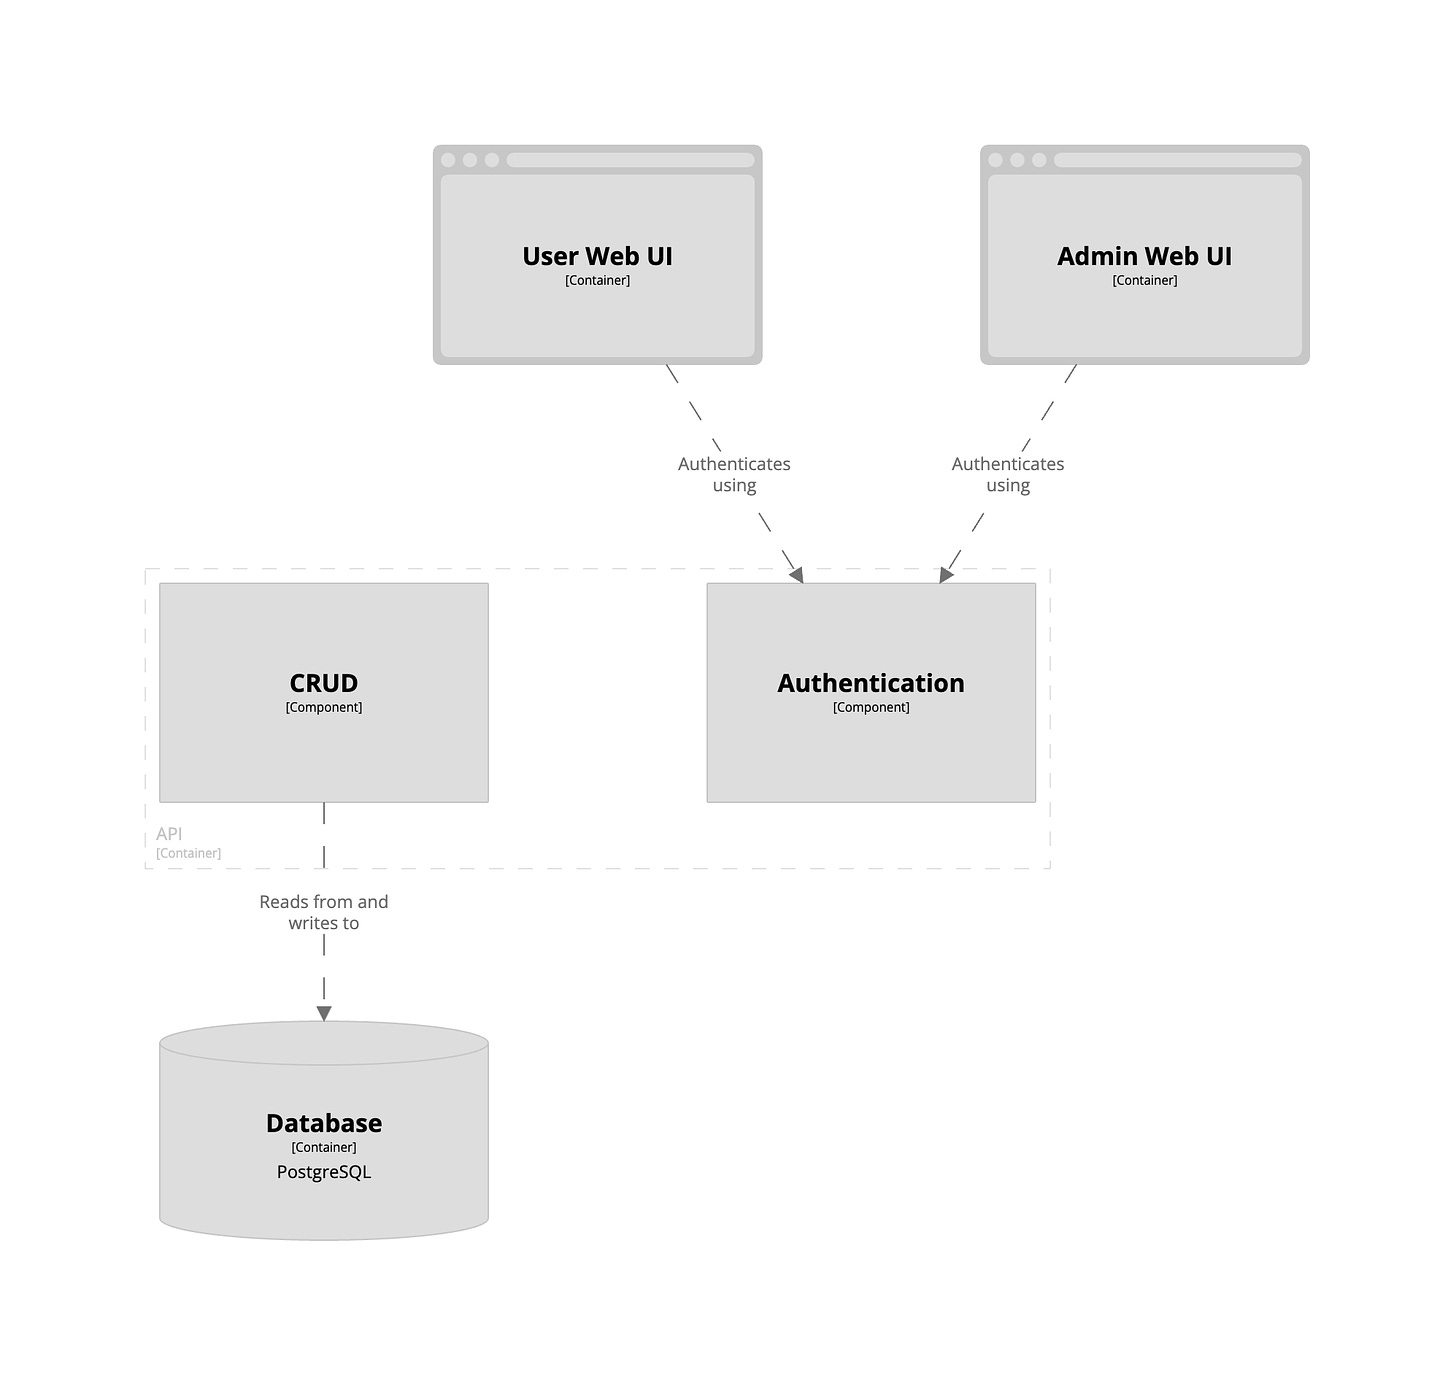
This diagram focuses on the internal structure of the API container within the Task Management Software System. It reveals that the API container houses crucial functionalities like CRUD operations (Create, Read, Update, Delete) for data manipulation and user authentication mechanisms. The CRUD components is the one that talks to the database.
Level 4: Code
The deepest level of zoom is the code diagram. Although this diagram exists, it is often not used as the code paints a very similar picture. However, in highly regulated environments and complex legacy projects this level can help to paint a better picture of inner intricacies of the software.

Supplementary Diagrams
Besides the 4 diagrams above, there are a couple more worth mentioning:
Deployment diagram
Dynamic diagram: to describe the process or a flow
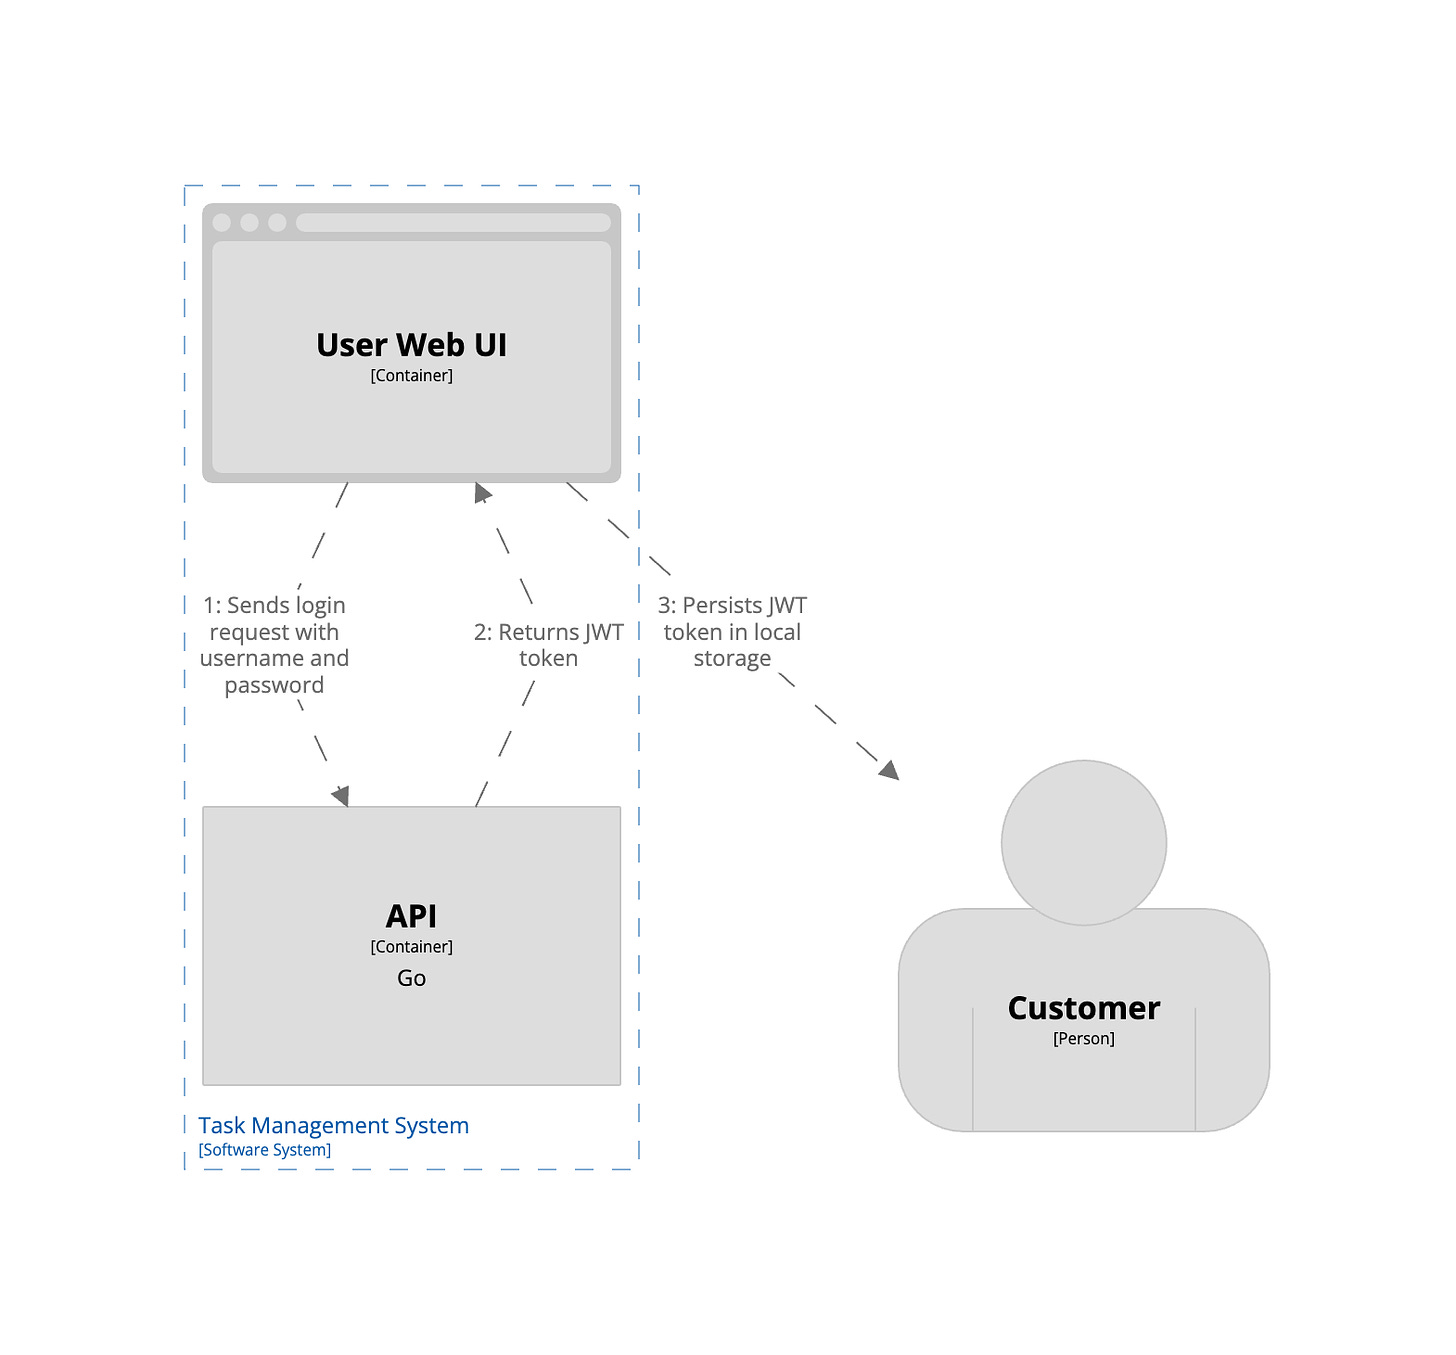
On this diagram we show a Login Flow, which is not a container or component, but rather a software process that happens in our software system. It shows that Web/Admin UIs use JWT-based authentication for communication with the API and the JWT token is stored in local storage on a client side.
Diagrams as Code
The power of C4 comes with a diagram-as-code approach. This means treating your diagrams just like your codebase:
Version control: Store them in a source control system (like Git) for easy tracking and collaboration.
Collaboration: Work together on diagrams using pull requests, similar to code reviews.
Automation: Integrate them into your build pipelines for automatic rendering with your preferred tools.
Helpful Tool: Structurizr
There are few tools to help with modeling and diagramming, but the most popular nowadays is Structurizr with their custom DSL (Domain Specific Language).
All you need is to get familiar with the DSL syntax, which is pretty simple. As long as you get used to it you will be able to create or update diagrams in no time.
Below you can see the DSL for our Task Management Software System.
workspace {
    model {
        # Actors
        customer = person "Customer" "" "person"
        admin = person "Admin User" "" "person"

        # External systems
        emailSystem = softwareSystem "Email System" "Mailgun" "external"
        calendarSystem = softwareSystem "Calendar System" "Calendly" "external"

        # Task Management System
        taskManagementSystem  = softwareSystem "Task Management System"{
            webContainer = container "User Web UI" "" "" "frontend"
            adminContainer = container "Admin Web UI" "" "" "frontend"
            dbContainer = container "Database" "PostgreSQL" "" "database"
            apiContainer = container "API" "Go" {
                authComp = component "Authentication"
                crudComp = component "CRUD"
            }
        }

        # Relationships (Actors & Systems)
        customer -> webContainer "Manages tasks"
        admin -> adminContainer "Manages users"
        apiContainer -> emailSystem "Sends emails"
        apiContainer -> calendarSystem "Creates tasks in Calendar"

        # Relationships (Containers)
        webContainer -> apiContainer "Uses"
        adminContainer -> apiContainer "Uses"
        apiContainer -> dbContainer "Persists data"

        # Relationships (Components & Containers)
        crudComp -> dbContainer "Reads from and writes to"
        webContainer -> authComp "Authenticates using"
        adminContainer -> authComp "Authenticates using"
    }
}
Let's dive into the most important parts:
workspace [name] [description] {
    model {
    }
}
Here we define our workspace which should have at least one model. A workspace can optionally be given a name and description.
customer = person "Customer" "" "person"
admin = person "Admin User" "" "person"
In this section we define our persons (for example, a user, actor, role, or persona) in the following format: person <name> [description] [tags].
You can use a similar format (name, description, tags) to identify the external systems:
        emailSystem = softwareSystem "Email System" "Mailgun" "external"
        calendarSystem = softwareSystem "Calendar System" "Calendly" "external"
To describe the internal software system we need to write a block that also shows its containers and components:
taskManagementSystem  = softwareSystem "Task Management System"{
    webContainer = container "User Web UI" "" "" "frontend"
    adminContainer = container "Admin Web UI" "" "" "frontend"
    dbContainer = container "Database" "PostgreSQL" "" "database"
    apiContainer = container "API" "Go" {
        authComp = component "Authentication"
        crudComp = component "CRUD"
    }
}
Container format:
container <name> [description] [technology] [tags]Component format:
component <name> [description] [technology] [tags]
The rest of the model is the most interesting part where we define the relationships between all parts (systems, containers, components):
apiContainer -> emailSystem "Sends emails"
The following format is used: <identifier> -> <identifier> [description] [technology] [tags].
There are other features available in Structurizr DSL, such as styling, themes, visibility, etc. You can find find them here.
Automate Rendering in Your CI
Since you can host your models on GitHub, it is very easy to automate the pipeline for rendering the diagrams in the tools of your choice.
In our case, Structurizr has a GitHub Action that allows you to run structurizr-cli, a command line utility for Structurizr that lets you create software architecture models based upon the C4 model using a textual domain specific language (DSL).
This sample repository contains a workflow that simply generates a static page and publishes it to GitHub Pages.
name: Deploy static content to Github Pages

on:
  push:
    branches: ["main"]

permissions:
  contents: read
  pages: write
  id-token: write

concurrency:
  group: "pages"
  cancel-in-progress: false

jobs:
  build:
    runs-on: ubuntu-latest
    container:
      image: ghcr.io/avisi-cloud/structurizr-site-generatr
      options: --user root
    steps:
      - name: Checkout
        uses: actions/checkout@v3
      - name: Create site
        run: |
          /opt/structurizr-site-generatr/bin/structurizr-site-generatr generate-site -w diagram.dsl
      - uses: actions/upload-artifact@v3
        with:
          name: website
          path: build/site
  deploy:
    needs: build
    environment:
      name: github-pages
      url: ${{ steps.deployment.outputs.page_url }}
    runs-on: ubuntu-latest
    steps:
      - uses: actions/download-artifact@v3
        with:
          name: website
          path: build/site
      - name: Setup Pages
        uses: actions/configure-pages@v3
      - name: Upload artifact
        uses: actions/upload-pages-artifact@v1
        with:
          path: "build/site"
      - name: Deploy to GitHub Pages
        id: deployment
        uses: actions/deploy-pages@v2
This Github Action uses Structurizr CLI action to compile our DSL file as HTML and publish it to Github Pages.
Conclusion
I believe that creating and maintaining effective and clear diagrams should be effortless. Up-to-date visuals ensure everyone stays on the same page, eliminating confusion and wasted time.
The C4 model and a bit of automation with Structurizr DSL can help make this process faster and keep diagrams close to the codebase. The whole process can now be automated as well into your SDLC.