

I have noticed that many engineers who run Kubernetes in production have never actually watched it heal itself. They know it does. They have read the docs. But they have never seen a ReplicaSet controller fire, an OOMKill from kubectl describe, or watched pod endpoints go empty during a cascading failure. That's where 3 am incidents find you. This tutorial puts you on the other side of it.
You will clone one repo, spin up a real 3-node cluster, break it seven different ways, and watch it fix itself each time. No simulated output or fake clusters. Real Kubernetes, real failures, and real recovery. By the end, you will recognize these failure patterns when they show up in your production environment.
Table of Contents
What is KubeLab?
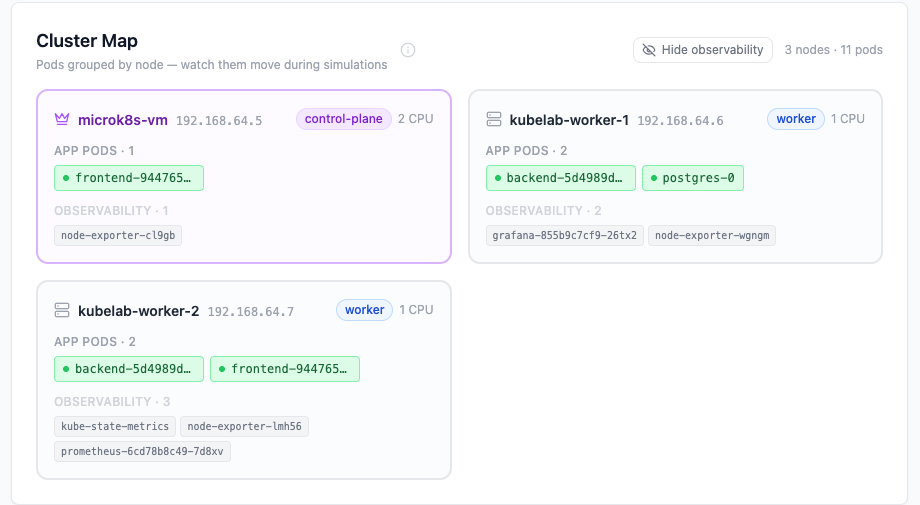
KubeLab is an open-source Kubernetes failure simulation lab. It runs a real Node.js backend, a PostgreSQL database, Prometheus and Grafana, all inside a real cluster. When you click "Kill Pod", the backend calls the Kubernetes API and deletes an actual running pod. Nothing is fake.
| Simulation | What it teaches |
|---|---|
| Kill Random Pod | ReplicaSet self-healing, pod immutability |
| Drain Worker Node | Zero-downtime maintenance, PodDisruptionBudgets |
| CPU Stress | Throttling vs crashing, invisible latency |
| Memory Stress | OOMKill, exit code 137, silent restart loops |
| Database Failure | StatefulSets, PVC persistence |
| Cascading Pod Failure | Why replicas: 2 isn't enough |
| Readiness Probe Failure | Liveness vs readiness, traffic control |
Plan about 90 minutes for the full path. Or jump directly to any simulation if you have a specific production problem you want to reproduce.
Prerequisites
You need basic familiarity with Docker and comfort with the command line, but no prior Kubernetes experience is required.
Hardware: 8GB RAM minimum, 16GB recommended. The lab can run on Mac, Linux, or Windows with WSL2. You'll need to install three tools. Multipass spins up Ubuntu VMs for the cluster. kubectl is the Kubernetes CLI you will use for every simulation. Git clones the repo. If you cannot run three VMs, the repo includes a Docker Compose preview at setup/docker-compose-preview.md full UI with mock data, no real cluster needed.
How to Get the Lab Running
Full cluster setup lives at setup/k8s-cluster-setup.md in the repo. It walks through creating three VMs with Multipass, installing MicroK8s, joining the worker nodes, and deploying KubeLab. Follow it until all eleven pods show Running:
kubectl get pods -n kubelab
# All 11 pods should show STATUS: Running
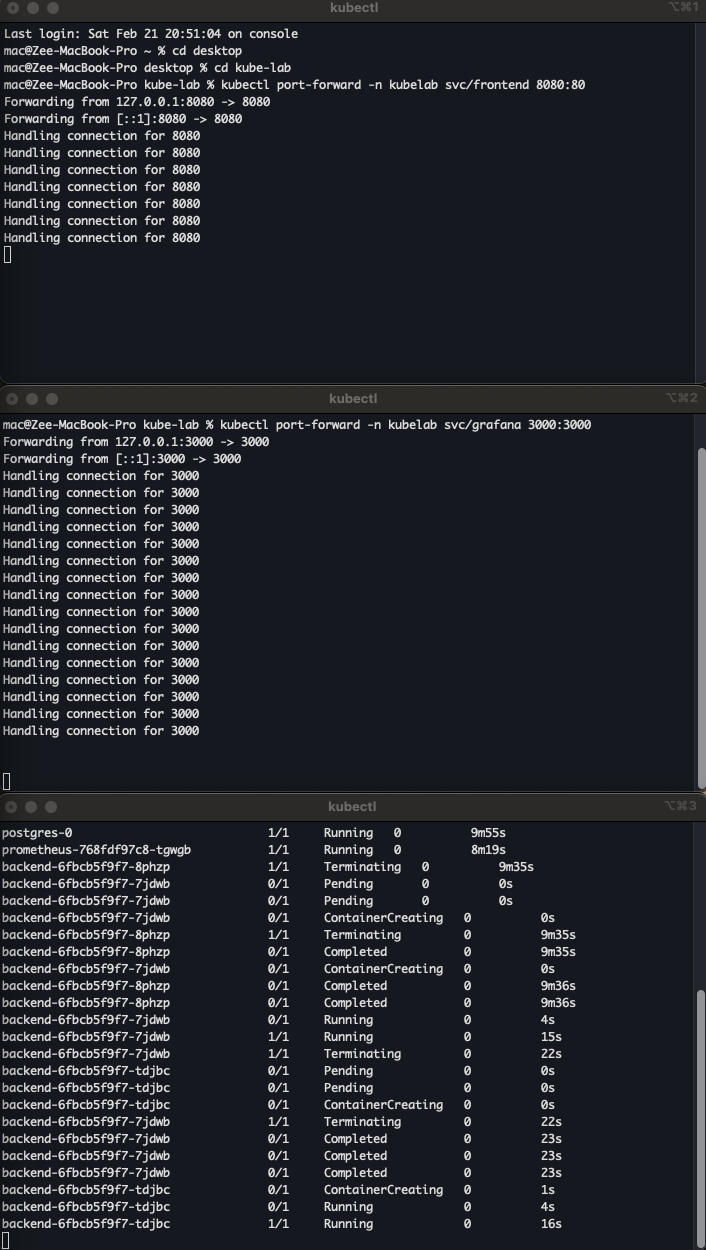
Then open two port-forwards in separate terminal tabs and keep them running for the entire tutorial:
# Tab 1 — KubeLab UI at http://localhost:8080
kubectl port-forward -n kubelab svc/frontend 8080:80

# Tab 2 — Grafana at http://localhost:3000
kubectl port-forward -n kubelab svc/grafana 3000:3000
Grafana login: admin / kubelab-grafana-2026.
Position the KubeLab UI and Grafana side by side. Left half of the screen is the app. Right half is Grafana. You will watch both simultaneously from Simulation 3 onward.
Simulation 1: Kill Random Pod
This simulation deletes a running backend pod via the Kubernetes API. Without Kubernetes, you would SSH to the server, find the crashed process, and restart it manually, usually discovered by a user alert at 3am.
Before you click: Run kubectl get pods -n kubelab -w. Watch for a pod to go Terminating then a new one to appear.
kubectl get pods -n kubelab -w
# backend-abc123  1/1   Terminating   0   2m
# backend-xyz789  1/1   Running       0   0s   ← ReplicaSet created a replacement
What happened: The ReplicaSet controller noticed actual(1) did not match desired(2) and created a replacement in parallel with the shutdown. The Endpoints controller removed the dying pod from the Service before SIGTERM fired, so zero traffic hit a dying pod.
The production trap: A missing readiness probe means the new pod receives traffic before it has opened a DB connection. You get 500s on every deployment for 2–3 seconds.
The fix: Set replicas: 2, add a readiness probe, and set terminationGracePeriodSeconds to match your longest request timeout.
Simulation 2: Drain a Worker Node
This simulation cordons a worker node, then evicts all its pods to the remaining node.
To "cordon" a worker node means to mark it as unschedulable. When you run kubectl cordon <node-name>, the Kubernetes control plane adds the node.kubernetes.io/unschedulable:NoSchedule taint to the node. (A taint is a marker that tells the scheduler to avoid placing pods on that node unless they have a matching "toleration.") This tells the scheduler to stop placing any new pods onto that node. It does not affect the pods that are already running there.
Cordoning is the first, safe step in preparing a node for maintenance. It ensures that while you are draining the node, the scheduler isn't simultaneously trying to schedule new workloads onto it, which would defeat the purpose of the drain.
Without Kubernetes you would drain the server manually, guess when in-flight requests finish, patch it, and bring it back, the window of downtime is unpredictable.
Before you click: Run kubectl get pods -n kubelab -o wide -w. Watch which node each pod runs on.
kubectl get pods -n kubelab -o wide -w
NAME                     NODE               STATUS
backend-abc123-xk2qp    kubelab-worker-1   Terminating   ← evicted
backend-abc123-n7mw3    kubelab-worker-2   Running       ← rescheduled
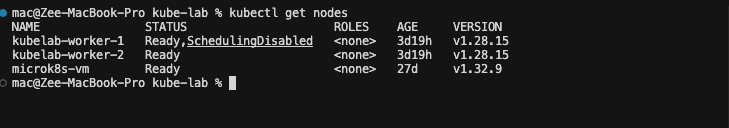
In kubectl get nodes the node shows Ready,SchedulingDisabled until you run kubectl uncordon.
What happened: The node spec got spec.unschedulable=true. The Eviction API ran per pod. That path goes through PodDisruptionBudget policy checks before proceeding, unlike a raw delete. A raw kubectl delete pod bypasses this check entirely — which is why draining with kubectl drain is always safer than deleting pods manually during maintenance.
The production trap: Two replicas with no pod anti-affinity often land on the same node. Drain that node and both pods evict at once. Complete downtime despite replicas: 2.
The fix: Use pod anti-affinity with topology key: kubernetes.io/hostname and a PodDisruptionBudget with minAvailable: 1.
Simulation 3: CPU Stress and Throttling
This simulation burns CPU inside a backend pod for 60 seconds, hitting the 200m limit. Without Kubernetes, one runaway process can consume all CPU on the host and starve every other service.
Before you click: Run watch -n 2 kubectl top pods -n kubelab and open the Grafana CPU Usage panel.
kubectl top pods -n kubelab
# backend-abc123   200m   ← pegged at limit for 60s; the other pod stays ~15m
What happened: The Linux CFS scheduler enforces the cgroup limit by granting 20ms of CPU per 100ms period then freezing all processes in the cgroup for 80ms. The pod is not slow because it is broken. It is slow because it is frozen 80% of the time.
The production trap: kubectl top shows the pod using 95-150m, which looks normal. The metric shows usage at the ceiling, not the throttle rate. Teams spend hours checking application code for a latency bug that is actually a CPU limit set too low.
The fix: For latency-sensitive workloads, set CPU requests but remove CPU limits. Requests tell the scheduler where to place the pod without throttling at runtime. Confirm throttling with rate(container_cpu_cfs_throttled_seconds_total{namespace="kubelab"}[5m]).

Simulation 4: Memory Stress and OOMKill
This simulation allocates memory in 50MB chunks inside a backend pod until the kernel kills it. Without Kubernetes the process dies, the server goes down, and someone gets paged.
Before you click: Run kubectl get pods -n kubelab -l app=backend -w and open the Grafana Memory Usage panel.
kubectl get pods -n kubelab -l app=backend -w
# backend-abc123   0/1   OOMKilled   3   5m   ← no Terminating phase; SIGKILL bypasses graceful shutdown
What happened: The cgroup memory limit crossed 256Mi. The Linux kernel OOM killer scored processes in the container's cgroup and sent SIGKILL (exit code 137) to the top consumer. Not Kubernetes, the kernel. SIGKILL cannot be caught or handled, so no preStop hook runs and in-memory data or open transactions can be lost. Kubernetes only observed the exit, labeled it OOMKilled, and started a fresh container.
The production trap: The pod runs fine for 8 hours, OOMKills, and restarts. Memory resets to zero and everything looks healthy again. This repeats every 8 hours. The restart count climbs to 7, then 15, then 30, but no alert fires because the metrics look normal between crashes. You find out when a user emails saying the app has been "a bit glitchy lately."
The fix: Alert on rate(kube_pod_container_status_restarts_total{namespace="kubelab"}[1h]) > 3 before users notice.
The Prometheus expression means: look at how many times containers in the kubelab namespace have restarted over the last hour, calculate how fast that number is increasing per second, and fire an alert if that rate exceeds the equivalent of 3 restarts per hour. A healthy pod rarely restarts. Several restarts in an hour usually means the container is hitting its memory limit, dying, and coming back in a loop, so this alert catches the silent OOMKill pattern before users do.
Confirm it happened:
kubectl describe pod -n kubelab <pod-name> | grep -A 5 "Last State:"
# Reason: OOMKilled
# Exit Code: 137
To see the last output before the kernel killed the process, run kubectl logs -n kubelab <pod-name> --previous. The log stream stops abruptly with no shutdown message, SIGKILL leaves no time for cleanup or final logs.

Simulation 5: Database Failure
This simulation scales the PostgreSQL StatefulSet to 0 replicas. The pod terminates completely. Without Kubernetes, the database server crashes and data recovery depends on whether backups exist and when they ran.
Before you click: Run kubectl get pods,pvc -n kubelab. Note that the PVC exists before you start.
kubectl get pods,pvc -n kubelab
# postgres-0   (gone)
# postgres-data-postgres-0   Bound   ← PVC stays; data lives on the volume
A PVC, or PersistentVolumeClaim, is a request for storage by a user. Think of it as a pod's way of saying, "I need a certain amount of durable, persistent storage." In the context of a stateful application like PostgreSQL, the PVC is critical. When the database pod is deleted, the PVC (and the underlying PersistentVolume it is bound to) remains. This is where the actual database files are stored. When a new postgres-0 pod is created, the StatefulSet knows to re-attach the same PVC, ensuring the new pod has access to all the old data, preventing data loss.
What happened: The StatefulSet controller deleted the pod but left the PersistentVolumeClaim untouched. StatefulSets guarantee stable names and stable PVC binding. postgres-0 always mounts postgres-data-postgres-0. When you restore, the same pod name comes back and reattaches the same volume. PostgreSQL replays WAL to reach a consistent state.
The production trap: Apps without connection retry logic return 500s and stay broken even after PostgreSQL restores. Connection pools that do not validate on acquire hold dead connections forever.
The fix: Add connection retry with exponential backoff in your app. Use network-attached storage (EBS, GCE PD) in production so the pod can reschedule to any node.
Simulation 6: Cascading Pod Failure
This simulation deletes both backend replicas at the same time. If everything is down, without Kubernetes, you'd have to restart every service manually, and hope they come up in the right order.
Before you click: Run kubectl get endpoints -n kubelab backend-service -w. Watch the IP list.
kubectl get endpoints -n kubelab backend-service -w
# ENDPOINTS   <none>   ← every request in this window gets Connection refused
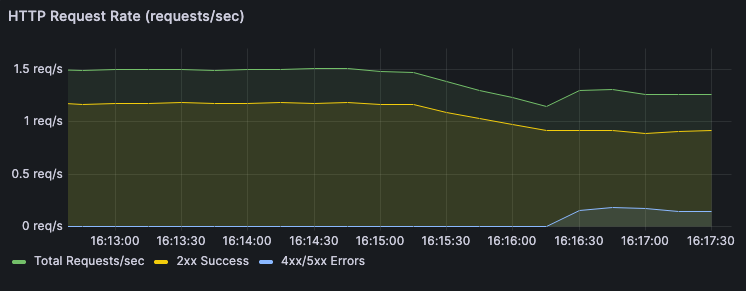
What happened: Both pods were deleted. The Service had zero endpoints. The ReplicaSet created two replacements in parallel, but traffic stayed broken until both passed their readiness probes. The endpoint list went empty and came back. You can see the exact downtime window in Grafana's HTTP Request Rate panel.
The production trap: replicas: 2 protects you from one pod dying at a time, nothing more.
If both replicas land on the same node and that node goes down, you have zero replicas and full downtime.
Check right now with kubectl get pods -n kubelab -o wide | grep backend, and if both pods show the same NODE, you are one node failure away from an outage.
The fix: Use pod anti-affinity to force replicas onto different nodes and a PodDisruptionBudget with minAvailable: 1 to block any voluntary action that would leave zero replicas.
Simulation 7: Readiness Probe Failure
This simulation makes one backend pod fail its readiness probe for 120 seconds without restarting it. Without Kubernetes, you'd have no way to take a pod out of traffic rotation without killing it. This is what happens in production when your app connects to a database on startup but the DB is slow. The pod is alive, but it's not ready. Kubernetes holds it out of rotation until it is.
Before you click: Run kubectl get pods -n kubelab -w in one tab and kubectl get endpoints -n kubelab backend-service -w in another.
# Pods tab: STATUS Running, RESTARTS 0 — almost nothing changes
# Endpoints tab: one IP disappears — the pod is alive but not receiving traffic
What happened: /ready returned 503. The kubelet marked the pod Ready=False. The Endpoints controller removed its IP from the Service. The liveness probe /health) still returned 200, so no restart. After 120 seconds /ready recovered and the pod rejoined. Run kubectl logs -n kubelab <failing-pod> -f to see the app log 503s for the readiness endpoint while the pod stays Running and receives no traffic.
The production trap: Readiness probes that check external dependencies (database, cache, downstream API) will remove all pods from rotation when that dependency goes down. Instead of degrading gracefully, your entire app goes offline.
The fix: Readiness probes should test only what the pod itself controls. Use a separate deep health endpoint for dependency checks and never tie readiness to external service availability.
4. How to Read the Signals in Grafana
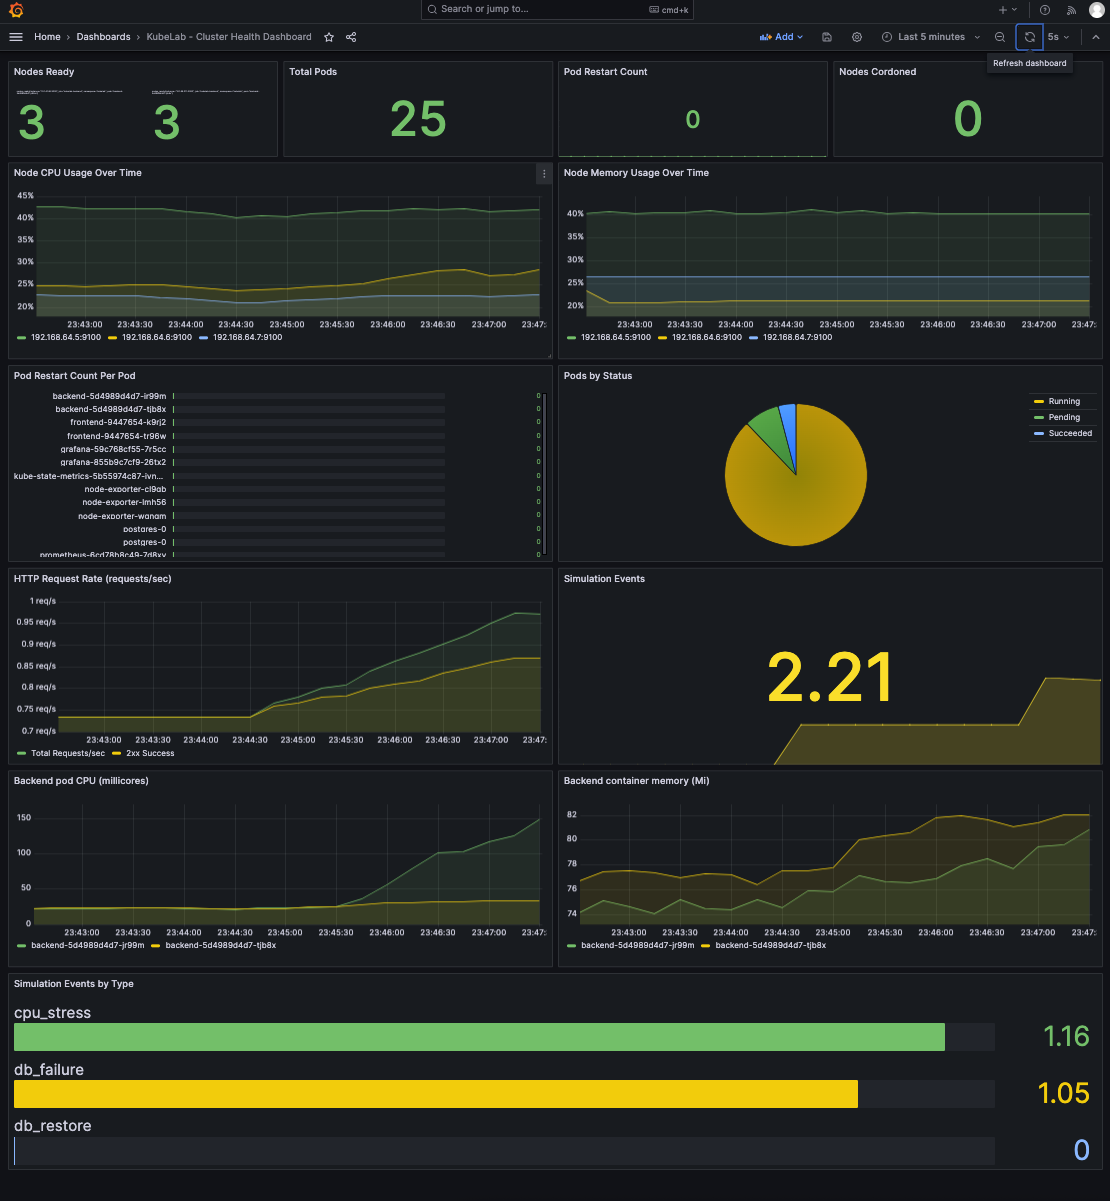
kubectl shows current state. Grafana shows what happened over time. That history is essential when you are debugging something that started 4 hours ago.
The Four Panels that Matter
Pod Restarts: A flat line is good. A step up every few hours is a silent OOMKill loop — the most common invisible production failure.
CPU Usage: A healthy pod's CPU fluctuates. A throttled pod's CPU is unnaturally flat at its limit. That flat ceiling is the signal, not the number.
Memory Usage: Watch for a line that climbs steadily then disappears. That disappearance is an OOMKill. The line reappearing from zero is the restart.
HTTP Request Rate: During Cascading Failure you see a spike of 5xx for 5–15 seconds, the exact downtime window, timestamped.
5. How to Read the Terminal Signals
What you see in the terminal during and after each simulation tells you things Grafana cannot. Five commands matter.
The -w flag on kubectl get pods -n kubelab -w streams changes in real time. The columns that matter are READY, STATUS, and RESTARTS. READY shows containers ready vs total — 1/2 means one container is alive but not passing its readiness probe. STATUS shows the pod lifecycle phase: Running, Pending, Terminating, OOMKilled. RESTARTS is the most important column in production. A number climbing silently over days is a memory leak or a crash loop nobody has noticed yet.
kubectl get events -n kubelab --sort-by=.lastTimestamp is the control plane's diary. Every action the cluster took is here: Killing, SuccessfulCreate, Scheduled, Pulled, Started, OOMKilling, BackOff. When something breaks and you do not know why, read the events. The timestamp gap between a Killing event and the next Started event is your actual downtime window — not an estimate, the exact number.
kubectl describe pod -n kubelab <pod-name> is the deepest single-pod view. Three sections matter: Conditions (Ready: True/False tells you if the pod is in the Service endpoints), Last State (shows the previous container's exit reason — OOMKilled, exit code 137, or a crash), and Events at the bottom (the scheduler's reasoning for every placement decision). This is the first command to run when a pod is misbehaving.
kubectl get endpoints -n kubelab backend-service shows which pod IPs are actually receiving traffic right now. A pod can show Running in kubectl get pods and be completely absent from this list. That is a readiness probe failure. If this list is empty, no request to that Service will succeed regardless of how many pods show Running. Check this whenever users report errors but pods look healthy.
kubectl logs -n kubelab <pod-name> shows the container's stdout and stderr. Use -f to follow the stream. After a pod restarts, use --previous to see the logs from the container that just exited, essential when you need to know what the app was doing right before an OOMKill or crash. Logs are per container and are gone once the pod is replaced, so grab them before the ReplicaSet creates a new pod with a new name.
A full event sequence during Kill Pod recovery looks like this:
kubectl get events -n kubelab --sort-by=.lastTimestamp | tail -10
REASON            MESSAGE
Killing           Stopping container backend          ← SIGTERM sent
SuccessfulCreate  Created pod backend-xyz789          ← ReplicaSet fired
Scheduled         Successfully assigned to worker-2   ← Scheduler placed it
Pulled            Container image already present     ← no pull delay
Started           Started container backend           ← running
The line between Killing and Started is your actual recovery time. In a healthy cluster with a cached image it is 3–8 seconds. If it takes longer, check the Scheduled line, the scheduler may have struggled to find a node.
Two Prometheus Queries Worth Memorizing
First query: silent restart loop. rate(kube_pod_container_status_restarts_total{namespace="kubelab"}[1h]) counts how many times containers in that namespace have restarted over the last hour and expresses it as a rate (restarts per second). A healthy workload rarely restarts. If this rate is high (for example more than 3 restarts per hour), something is killing the container repeatedly, often an OOMKill or a crash. Alert when it exceeds a threshold so you see the pattern before users report errors.
Second query: invisible CPU throttling. rate(container_cpu_cfs_throttled_seconds_total{namespace="kubelab"}[5m]) measures how much time, per second, the Linux scheduler spent throttling containers in that namespace over the last 5 minutes. A result of 0.25 means the container was frozen 25% of the time. High latency with no restarts and "normal" CPU usage in kubectl top often means the CPU limit is too low and the kernel is throttling the process. Alert when this rate exceeds about 0.25 (25% throttled).
# Silent restart loop — alert when this exceeds 3 per hour
rate(kube_pod_container_status_restarts_total{namespace="kubelab"}[1h])

# Invisible throttling — alert when this exceeds 25%
rate(container_cpu_cfs_throttled_seconds_total{namespace="kubelab"}[5m])
Run these against your own cluster. Not just KubeLab. These are production queries.
6. How to Use This for Production Debugging
The repo includes docs/diagnose.md, a symptom-to-simulation map. Find the simulation that reproduces your issue, run it in KubeLab, and understand the mechanics before you touch production.
Exit code 137, pods restarting. Run the Memory Stress simulation. Confirm with kubectl describe pod | grep -A 5 "Last State:" and look for Reason: OOMKilled. Raise limits or find the leak. The simulation shows both.
High latency, pods look healthy, zero restarts. Run the CPU Stress simulation. Check container_cpu_cfs_throttled_seconds_total in Prometheus. If it climbs, your CPU limit is too low and the pod is frozen by CFS.
503 on some requests, pods show Running. Run the Readiness Probe Failure simulation. Check kubectl get endpoints — one pod IP is missing despite Running. The pod gets zero traffic.
Pods stuck Pending after a node went down. Run the Drain Node simulation. Run kubectl describe pod <pending-pod> and read Events. The scheduler will state why it cannot place the pod, often insufficient capacity or a PVC on the failed node.
Conclusion
You just broke a real Kubernetes cluster seven ways and watched it fix itself each time. You have seen the ReplicaSet controller fire, read an OOMKill from kubectl describe, watched endpoints go empty during a cascading failure, and understood why a pod can be Running and receiving zero traffic at the same time.
What you practiced here applies to other clusters, staging or production you can read but not safely break. That muscle memory (events, endpoints, restart counter) is what you reach for at 3 am when something is wrong. KubeLab is the safe place to build that reflex.
The repo holds more than this article covered. Explore mode lets you run simulations without the guided flow. The full interview prep doc at docs/interview-prep.md has answers to the 13 most common Kubernetes interview questions. The observability guide at docs/observability.md covers Prometheus and Grafana setup in detail.
If this helped you, star the repo at https://github.com/Osomudeya/kube-lab and share it with someone who is learning Kubernetes the hard way.